
Incremental housing units between 2000 and 2020 by Planning Area
Map by RPA based on Historical Housing Unit and Urbanization Database (HHUUD) and the 2001 State Development and Redevelopment Plan (SDRP) policy map designations. For clarity purposes, the legend consolidates environmentally sensitive areas, parks, meadowlands/and water areas into aggregated categories.
Key Findings
Background
The adopted 2001 Plan is the most recent iteration of the New Jersey State Development and Redevelopment Plan. A preliminary draft of the updated 2024 NJ State Plan was recently published in December 2024 and is currently undergoing the cross-acceptance process.
Under the 2001 Plan, Statewide residential development is promoted in “smart growth” areas, primarily represented by the Metropolitan (PA1) and Suburban (PA2) Planning Areas, as well as their designated Centers.
Although the provisions under the State Plan are not fully enforceable, they serve as a statewide forward-looking blueprint for guiding growth and conservation in New Jersey’s geographically diverse regions. The New Jersey State Development and Redevelopment Plan does not supersede local land use regulations.
The voluntary Municipal Plan Endorsement process allows municipalities to receive state recognition for their master plans and land use regulations, ensuring alignment with the State Plan. This endorsement enhances coordination among planning efforts and offers incentives, such as priority access to infrastructure funding and technical assistance.
Housing Production
- Following the 2001 Plan, the state experienced a shift toward more compact housing development, characterized by a larger share of new stock in Metropolitan areas and an increase in multifamily building types. This has reduced the sprawling nature of development and limited the loss of open space and farmland, consistent with the principles of “smart growth”. However, the period from 2000 to 2020 saw a decrease of 173,400 incremental housing units across the state compared to the 1980s and 1990s, marking a 28% reduction. This decline is likely attributed to a 15-year gap in the enforcement of Mount Laurel obligations from 2000 to 2015, which has exacerbated issues related to housing affordability.
- During the 2000-2020 period, Metropolitan Areas (PA1) added 232,000 units, representing 52% of the total statewide growth, far more than in any other planning area. In Suburban Areas (PA2), new unit production declined sharply, from 184,000 (29% of total new units) between 1980 and 2000 to 79,000 (17% of total new units). The lower production in other planning areas led to reduced growth across the state as a whole.
- The shifts between Planning Areas are reflected in the types of housing being built. Multifamily housing (five or more units) saw a significant increase from 78,500 units in the 1980s and 1990s (13% of the total new stock during that period) to 136,200 units in the 2000s and 2020 (29% of the new stock). While new single-family homes continue to dominate, with 224,600 units built between 2000 and 2020 (accounting for 48% of the new stock), this represents a decline from the 364,000 units built in the 1980s and 1990s (which accounted for 59% of total new units during that period).
Housing Affordability
- As of 2023, both rental and homeowner vacancy rates are at their lowest levels in over a decade. As a result of housing underproduction, New Jersey’s rental vacancy rate has dropped from 7.5% in 2010 to 3% in 2023, while the homeowner vacancy rate has fallen from 2% to 0.5% over the same period.
- Resulting from these tight market conditions, the statewide average home value has more than tripled since 2000 and nearly doubled since 2010, excluding prospective buyers from the benefits of homeownership. Since 2010, New Jersey’s typical home value increased from $313,000 to $564,000, representing a rise of $250,650.
- Rents have also soared across all market segments. Of the five major cities, Jersey City has ranked the highest over the past decade, closely followed by Toms River, with an average of $3,236 and $3,094, respectively. Jersey City’s typical observed market rent is nearly 60% higher than the national average ($2,024). While the average rent in Newark remains comparatively more affordable, it has increased by 100% from $1,104 in 2015 to $2,215 today.
Housing and Transit
- Approximately 1.7 million housing units throughout the state are located near transit, including both rail and bus lines. This represents 45% of the state’s total stock. Over 1.5 million housing units located in proximity to transit are also situated within Metropolitan Areas (nearly 90% of the total within the transit zone).
- Between 2000 and 2020, the state added approximately 176,000 housing units in areas close to transit stops. Such growth represents 39% of the statewide housing increase during that period. This also represents a substantial increase compared to the growth observed before the adoption of the 2001 Plan. During the 1980s and 1990s, the state added approximately 128,000 units in areas near transit, 21% of the total statewide increment during that period.
- While almost half of New Jersey’s statewide housing stock is located near a transit stop, most of it is situated in areas that lack the necessary residential density and ridership to support transit service. Less than 828,000 units, representing 22% of the total statewide housing stock, are located in areas with sufficient density to sustain bus service. Even in areas close to transit, approximately 963,000 units (56% of the total stock within the transit zone) are situated in areas that lack the density to support bus service.
Housing and Coastal Flooding
- As of 2020, approximately 346,100 units are exposed to coastal storm surge flooding that could result from a Category 2 Hurricane, closely matching the number of units damaged or destroyed by Hurricane Sandy in 2012. Approximately 112,000 of such units (33% of the total stock exposed) are located in Metropolitan areas. Another 94,800 units (27% of total stock exposed) are situated in Environmentally Sensitive areas, including 58,200 units (17% of total stock exposed) within Barrier Island areas.
- Between 2000 and 2020, approximately 52,000 new units were built in areas exposed to coastal flooding. Most of the new stock exposed to coastal flooding is situated in Metropolitan Areas (PA1), with almost 14,000 new units or 27% of the new stock at risk. An additional 7,100 units in Suburban areas (PA2) were built in locations exposed to flooding (14% of the new stock exposed). Fringe and Rural areas (PA 3 & 4) added 10,400 new units, corresponding to 20% of the new stock exposed. Approximately 8,500 new units in Environmentally Sensitive locations (PA 5, 42, and 52) were built in areas at risk (17% of new stock exposed), including 4,000 in Barrier Islands.
Recommendations
- Housing, transportation, and resiliency goals under the new updated State Plan must acknowledge needs that are both regional in scale and dynamic in time. Efforts to minimize flood risk and address the housing shortage should consider local flood exposure conditions and attributes that favor “smart growth” through compact, walkable, and transit-oriented development, leveraging both urban mass transit and the state’s extensive suburban rail network.
- To achieve the recommendation above, the new plan and related Policy Map should develop a more nuanced framework to integrate Planning Areas and corresponding policies. As currently defined, these are too broad to capture the distinctions between the issue areas examined in this report. Metropolitan Planning Areas (PA1) in particular require policies that better reflect distinctions between residential density, transit proximity, and flood risk.
Historical Planning Context (1930-2025)
“…conserve its natural resources, revitalize its urban centers, protect the quality of its environment, and provide needed housing and adequate public services at a reasonable cost while promoting beneficial economic growth, development and renewal”
(N.J.S.A. 52:18A-196)
Under the State Planning Act, the newly formed State Planning Commission would be responsible for formulating a State Development and Redevelopment Plan (SDRP) and facilitating a statewide, collaborative planning process, called Cross-acceptance. This process highlights that statewide planning is not a siloed journey, but one that solicits a negotiation process and participation of all levels of government and the public in the review and preparation of the final draft of the State Plan.
One of the key mechanisms to implement the State Plan at the local level is the voluntary Municipal Plan Endorsement process. Through this process, municipalities can apply for state recognition that their local master plans and land use regulations align with the goals, policies, and spatial framework of the State Plan. Endorsement strengthens the coordination between state, county, and local planning, and provides municipalities with access to certain incentives, such as priority consideration for infrastructure funding and technical assistance. It also reinforces the collaborative intent of the Cross-acceptance process by ensuring local plans remain consistent with regional and statewide objectives.
“…a process of comparison of planning policies among governmental levels with the purpose of attaining compatibility between local, county, and State plans. The process is designed to result in a written statement specifying areas of agreement or disagreement and areas requiring modification by parties to the cross-acceptance.”
(N.J.S.A. 18A-202b.)
Although the provisions under the State Plan would not be mandated, they would serve as a statewide forward-looking blueprint for guiding growth and conservation in New Jersey’s geographically diverse regions. The first iteration of the State Plan, along with its State Plan Policy Map (or “Policy Map”), was adopted in 1992. The 2001 State Plan, also the second iteration of the Plan, has served as the version that has remained in effect as the statewide planning document for the last two decades.
2001 New Jersey State Development and Redevelopment Plan
The 2001 State Plan was developed with a forward-looking vision for New Jersey in the year 2020. This version of the State Plan acknowledges the impact that the location, type, and scale of development, redevelopment, and conservation efforts have on all aspects of life in New Jersey. Vibrant, livable communities and environmental stewardship can only emerge through careful planning and informed decision-making that involves citizens and agencies at all levels of government. The Statewide Policies outlined in the Plan must be applied to public and private decisions through the State Plan Policy Map, which provides a spatial understanding of the opportunities and constraints of the state’s diverse geographies.
The 2001 State Plan Policy Map
To coordinate this balance between opportunities and constraints, the 2001 State Plan emphasizes that growth in more efficient and compact forms can help ensure high-quality public facilities and services, as well as the conservation of natural landscapes. The State Plan Policy Map introduces the spatial concept of Planning Areas, Centers/Nodes, and Environs to achieve the Plan’s goals and Statewide Policies, as deemed necessary. The 2001 Plan identifies Metropolitan and Suburban Planning Areas (PA1 & PA2) as locations where growth was to be promoted. Other categories where growth could be accommodated (limited to “well-designed centers”) include Fringe (PA3), Rural (PA4), and some Environmentally Sensitive areas (PA5).
As defined in the 2001 State Plan, each of the designated Planning Areas are composed of land masses with tracts that share certain unique natural and built environment characteristics, making them suitable for a common application of policy, planning, and development. There are five primary Planning Areas – PA1: Metropolitan; PA2: Suburban; PA3: Fringe; PA4: Rural; PA4B: Rural/Environmentally Sensitive; PA5: Environmentally Sensitive; PA5B: Environmentally Sensitive Barrier Island – that are used to categorize New Jersey’s geography. Given the large size of these boundaries, the Policy Map identifies Center boundaries for a clearer distinction between where growth should be promoted or accommodated within the Planning Areas. Areas beyond the Centers are defined as Environs, and should be leveraged to further contain growth and the protection of natural and environmentally sensitive landscapes. The interaction between these delineated Areas ultimately serves as the framework for structuring smart growth, limited growth, agriculture, open space, conservation, and other relevant categories established by the State Planning Act.
The State Plan outlines policy objectives that guide the implementation of statewide policies within each Planning Area. This means that the scale of growth and conservation varies across regions, tailored to the distinct needs and capacities of each Planning Area, as well as their unique geographical features. As these Planning Areas may not necessarily align with municipal boundaries, it is crucial that cross-agency coordination and partnerships occur between all levels of government to ensure strategic development, redevelopment, and conservation. For instance, the State Plan may prioritize ecologically designed, compact forms of development and redevelopment in “smart growth areas.” These areas include Metropolitan and Suburban Planning Areas, Designated Centers, Pinelands Regional Growth Areas, Villages and Towns. This localized approach ensures that development is both sustainable and responsive to the specific environmental, social, and economic contexts of each area.
Establishing the Planning Area boundaries are guided by the delineation criteria set forth in the State Plan, and local context may require flexible application of the criteria to achieve the Planning Objectives of each Planning Area.


Residential Development Trends (1940 - 2020)
By analyzing the housing stock over time and according to the Planning Area Boundaries delineated in the 2001 State Plan, it is possible to see where the housing stock has been growing and the scale of that growth over the decades.
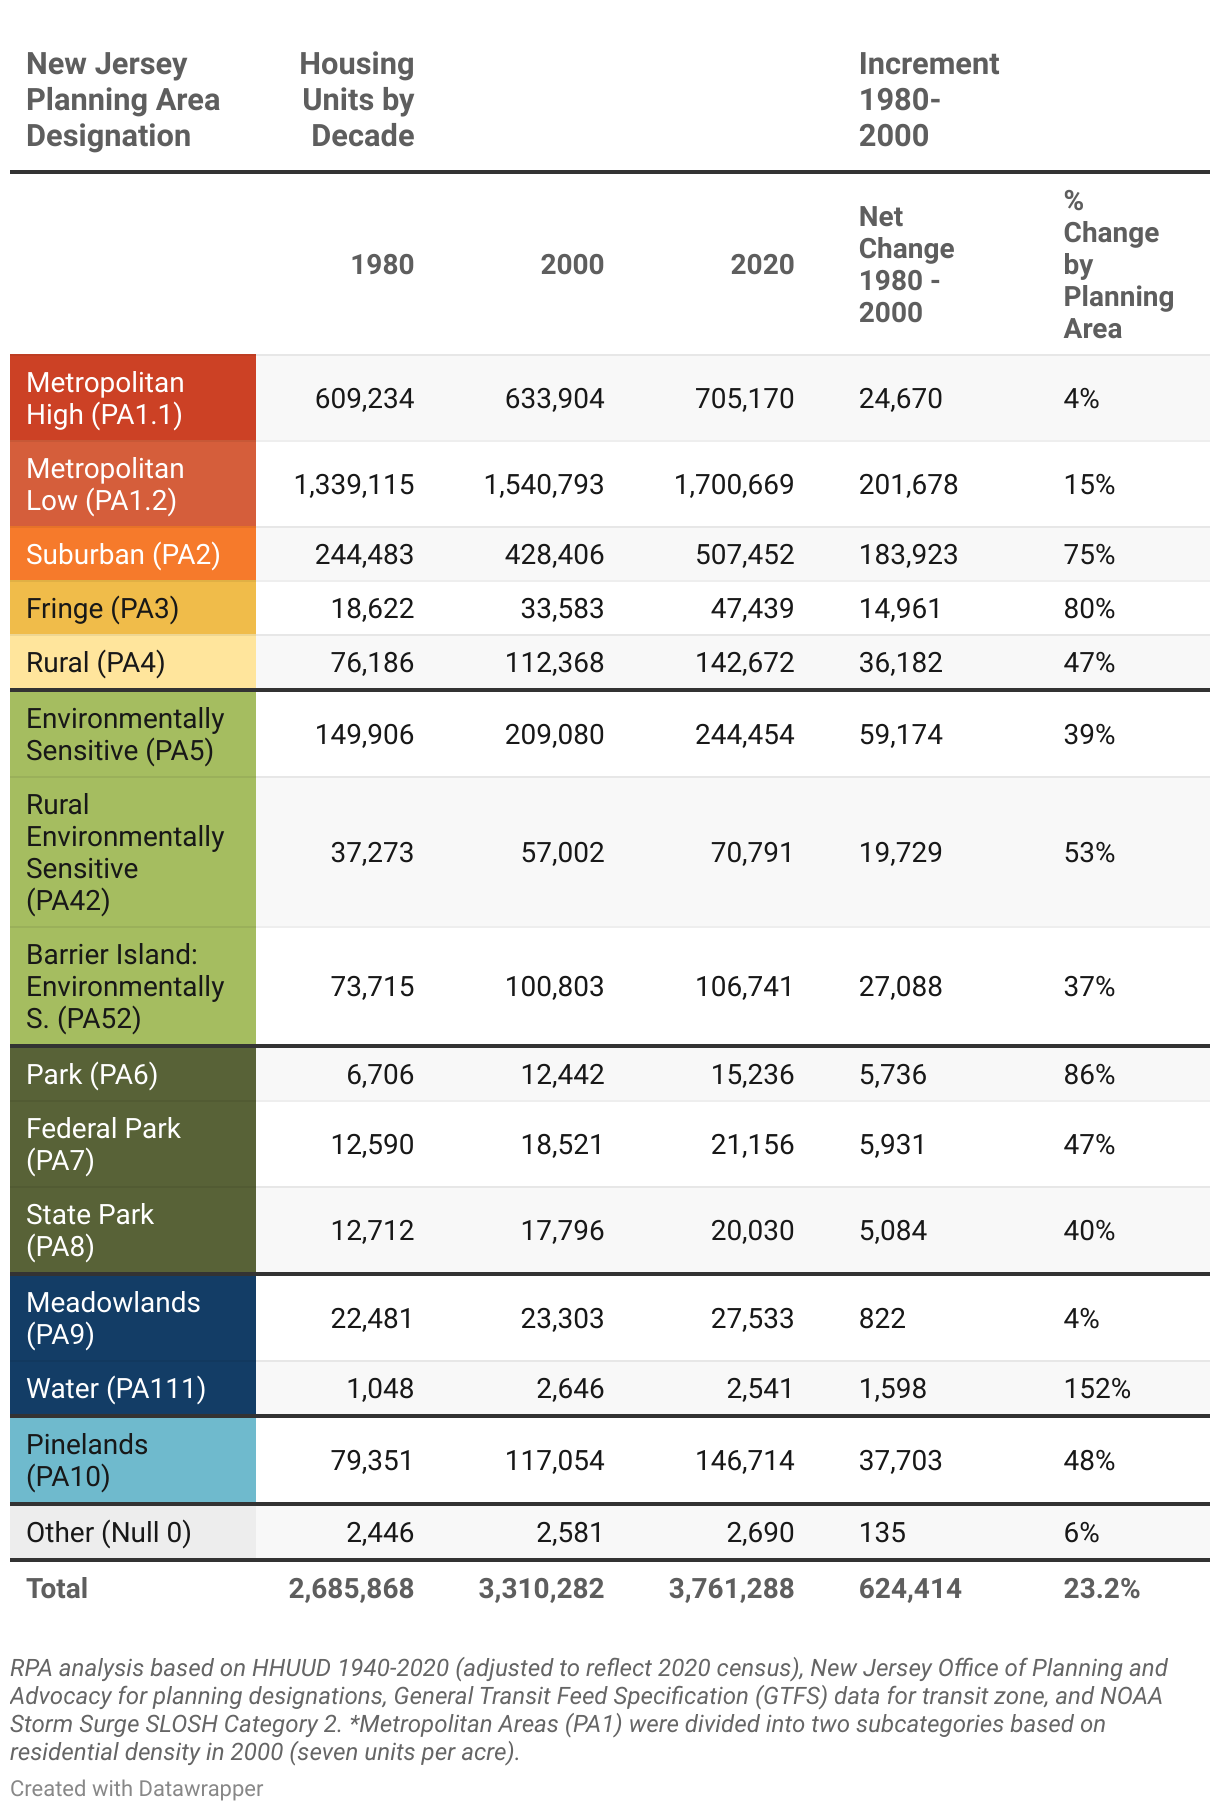
Since 1940, New Jersey has experienced an upward trend in the total number of units added to its housing stock. Between 1940 and 2020, New Jersey’s stock tripled from 1.2 million to more than 3.7 million housing units, a 2.5 million increase over 80 years. Of this increase, 1.4 million units (55% of the net increment) were built in areas designated as Metropolitan Planning Areas (PA1). As of 2020, housing units in Metropolitan areas add to over 2.4 million, representing 64% of the state’s total stock. In contrast, Suburban Planning Areas (PA2) grew from 44,000 units in 1940, less than 4% of the total in that decade, to now comprising over half a million units, accounting for 13% of the state’s total in 2020.
Housing stock located in both Metropolitan and Suburban areas represented over 2.9 million units in 2020, accounting for 77% of the state’s total. The remaining 850k units, 23% of the total, are distributed among other Planning Areas, including Fringe (PA3), Rural (PA4), and Environmentally Sensitive areas (PA5). While some growth has continued in these locations, the net number of units has stabilized over the last two decades.
Following the 2001 Plan, the state experienced a shift toward more compact housing development, characterized by a larger share of new stock in Metropolitan areas and an increase in multifamily building types. This has reduced the sprawling nature of development and limited the loss of open space and farmland. However, when compared to the 1980s and 1990s, the period from 2000 to 2020 saw a significant reduction in units produced across the state. This decline is likely attributed to a 15-year gap in the enforcement of Mount Laurel obligations from 2000 to 2015, which exacerbated issues related to housing affordability.
Incremental Units by Planning Area
To better discern development trends within Metropolitan Areas (PA1), RPA created subcategories based on residential density. We defined a threshold based on seven dwelling units per acre (as measured in the year 2000), which is the minimum generally considered necessary to support bus service. With this, we created high and low-density subcategories of Metropolitan Areas (PA1.1 and PA1.2, respectively). The higher-density locations (PA1.1) are primarily concentrated in northern New Jersey, including but not limited to Jersey City, Hoboken, Union City, Fort Lee, Newark, Elizabeth, Paterson, and Orange, as well as Trenton and Camden in central New Jersey, and Atlantic City, Asbury Park, and Neptune City along the shore.
While more than half of total residential development between 2000 and 2020 occurred in the Metropolitan Planning Areas (PA1), most of that growth has been taking form in places in around the peripheries of the established urban centers mentioned above, in areas characterized to have less than seven dwelling units per acre, or moderate- to low-density (Metropolitan Areas PA1.2 areas).
In the decades following the 2001 Plan (2000-2020), higher-density Metropolitan Areas (PA1.1) experienced a growth of 71,300 units, representing almost 16% of the statewide increase in that period, or three times more than in the previous decades (1980s and 1990s). However, despite the accelerated growth within higher-density Metropolitan Areas (PA1.1), these numbers were eclipsed by the 159,900 additional units created in lower-density Metropolitan Areas (PA1.2), which represented 35% of the net gains during the 2000-2020 period.
Incremental Units by Building Type
Between 1980 and 2020, the statewide housing stock expanded by 1.1 million units, representing a 40% increase. Despite this growth, the overall mix of housing by building type remains relatively unchanged, particularly among detached single-family and multi-family units. From this 40-year period, detached single-family homes have consistently comprised around 53% of the total housing stock, while multi-family units have maintained a share of roughly 20%. A more noticeable shift has occurred in the production of attached single-family and mid-density units, which have experienced a 5% increase and a 10% decrease, respectively, during the same time frame.
While new single-family homes continue to dominate the housing market, representing ⅔ of new stock built between 2000 and 2020, a noticeable shift has occurred in the types of housing units following the adoption of the 2001 State Plan. Multifamily housing (five or more units) saw a significant increase from 78,500 units in the 1980s and 1990s (13% of the total new stock during that period) to 136,200 units in the 2000s and 2020 (29% of the new stock). The significant increase in multifamily units is further evidenced by the steady rise from 2004 to 2022 in the percentage of residential Certificates of Occupancy (COs) issued for units allocated in multifamily structures or mixed-use projects.
Between 1980 and 2000, detached single-family homes (363,900 units) and attached single-family homes (151,000 units) combined accounted for 83% of all housing units added. In contrast, from 2000 to 2020, the numbers of detached (224,604 units) and attached (82,141 units) single-family homes declined, resulting in them representing 66% of the new housing stock.
The production of middle-density housing increased from 14,500 units during the 1980s and 1990s to 19,350 units between 2000 and 2020. However, it is important to note that middle-density housing still accounts for less than 5% of the incremental housing stock for both time periods.
Despite this shift towards more compact housing development in the decades following the 2001 Plan, overall housing production from this period has declined by approximately a quarter compared to the period prior to the Plan’s adoption. Underproduction of housing, particularly for typologies beyond single-family homes, likely contributes to New Jersey’s worsening housing supply and affordability crisis.


Trends in Market Rents and Home Values (2010 - 2025)
Since 2010, New Jersey has experienced a steady rise in both market-rate rents and home values, a trend reflected across the state’s metro areas and major cities. The broader New York Metropolitan Area ranks first in Zillow’s Typical Observed Market Rent, with Jersey City ranking a close second, and Toms River trailing closely behind. Similarly, the Zillow Home Value Index, which is a measure of typical home values and market changes across a given region and housing type, reveals that home values across New Jersey have experienced a steady upward trajectory and recovery following the decline in 2010 and 2013. While average rent and home value thresholds have varied by region, all NJ metro areas and major cities have experienced sustained price increases over the past decade.
Trends in Vacancy Rates (2010 - 2023)
The inverse relationship between vacancy rates and typical market rent and home values speaks to the intensifying housing burdens that New Jersey residents, particularly low-income residents, are facing. Since 2010, New Jersey has experienced a decline in rental and homeowner vacancy rates, with both rates currently at their lowest levels as of 2023. Limited access to affordable and available housing units on the market has driven up rental and housing costs, a trend that is evident at the statewide level, in New Jersey’s major cities, and metropolitan areas.
Incremental Housing in Transit Zone by Planning Area
RPA measured the incremental number of housing units according to the Planning Area Boundaries delineated in the 2001 State Plan, and in relation to their proximity to transit. To do this, we defined a study area based on the distribution of rail stations and bus stops in the state. We drew a half-mile radius around each rail station, and a quarter-mile around bus stops to define New Jersey’s Transit Zone (NJTZ).
Between 2000 and 2020, the state added approximately 176,000 housing units in locations within New Jersey’s Transit Zone. Such growth represents 39% of the statewide housing increase during that period. This represents a substantial increase compared to the growth observed before the adoption of the 2001 Plan. During the 1980s and 1990s, the state added approximately 128,000 units in areas near transit, which represents 21% of the total statewide increment during that period.
Residential Density and Transit Zone
More compact and mixed-use forms of development largely depend on the availability and access to public transportation. Areas with higher residential density tend to have more people and households within a smaller space, making it easier to support frequent and reliable service. This higher density translates into more potential riders, which may offset the costs of providing service and reduce the need for government subsidies. At the same time, increased density enables and justifies larger investments in transit infrastructure and services. This virtuous cycle helps reduce dependency on private vehicles, which are a significant source of pollution and environmental degradation.
While almost half of New Jersey’s statewide housing stock is located near a transit stop (1.7 million units, representing 45%), most of it is situated in areas that lack the necessary residential density and ridership to support transit service and transit-oriented communities. Less than 828,000 units, representing 22% of the total statewide housing stock, are located in areas with sufficient density to sustain bus service. Less than 362,000 (9.7% of statewide) are located in areas with sufficient density to support express bus service. Even within the transit zone boundaries (NJTZ), approximately 963,000 units are located in areas with densities below the minimum required to support bus service. This represents 56% of the total stock within the transit zone.
In the absence of these densities (and the ridership that supports transit), operators either become more reliant on subsidies or vulnerable to declining service. Directing future growth into the NJTZ through better coordination and alignment between housing and transportation planning efforts should remain a key goal going forward.


In 2012, a decade after the adoption of the 2001 Plan, Hurricane Sandy followed an unusual path through the North Atlantic, impacting New Jersey and the broader Tri-State region. The storm tide in Sandy Hook reached over 8.9 feet, and almost completely submerged barrier islands in Ocean County as the storm surge met rising waters from back bays like Barnegat Bay. According to the Governor’s office, approximately 346,000 housing units were damaged or destroyed across the state, with 22,000 units rendered uninhabitable.
As of 2020, approximately 9.2% of the state’s total stock is exposed to coastal storm surge flooding that could result from a Category 2 Hurricane. Over the next 25 years, 565,000 parcels, representing 16.4% of properties statewide, will be exposed to major flood risk, threatening $435.9 billion in market value. Understanding localized characteristics related to potential growth and flood risk will be crucial for minimizing exposure to flood risk and reducing the housing deficit in the next few decades.
Housing Exposed to Coastal Flooding
Storm surge is an abnormal rise in sea level caused by a storm’s winds pushing water towards the shore. Wave action, generated by the storm’s winds, rides on top of the storm surge, exacerbating coastal flooding and damage.
As of 2020, approximately 346,100 units, representing 9.2% of the state’s total stock, are exposed to coastal storm surge flooding that could result from a Category 2 Hurricane. Approximately 112,000 of such units (33% of the total stock exposed) are located in Metropolitan areas (PA1). Another 94,800 units (27% of total stock exposed) are situated in Environmentally Sensitive areas, including 58,200 units (17% of total stock exposed) within Barrier Island areas (PA52).
Incremental Units in Areas Exposed to Coastal Flooding
RPA compared the stock between 2000 and 2020 to measure the increase in residential units constructed in coastal flood-prone areas. Between 2000 and 2020, approximately 52,000 new units were built in areas exposed to coastal flooding. Most of the new stock exposed to coastal flooding is situated in Metropolitan Areas (PA1), with almost 14,000 new units or 27% of the new stock at risk. An additional 7,100 units in Suburban areas (PA2) were built in locations exposed to flooding (14% of the new stock exposed). Fringe and Rural areas (PA 3 & 4) added 10,400 new units, corresponding to 20% of the new stock exposed. Approximately 8,500 new units in Environmentally Sensitive locations (PA 5, 42, and 52) were built in areas at risk (17% of new stock exposed), including 4,000 in Sensitive Barrier Islands.
Unfortunately, flooding hazards, increased by climate change, will continue to exacerbate the housing shortage. The growing risk of climate-driven flooding poses a significant threat to both existing and future housing developments in flood zones. Understanding localized characteristics related to potential growth and flood risk while maintaining a regional perspective will be crucial for both minimizing exposure to flood risk and reducing the housing deficit going forward.


Housing, transportation, and resiliency goals under the new updated State Plan must acknowledge needs that are both regional in scale and dynamic in time. Efforts to minimize flood risk, preserve open space and farmland, and address the housing shortage should consider local flood exposure conditions and attributes that favor “smart growth” through compact, walkable, and transit-oriented development, leveraging both urban mass transit and the state’s extensive suburban rail network.
Municipalities and planning areas that are expected to experience lower flood exposure and have a greater potential for smart growth should promote transit-oriented development, mixed-use multifamily buildings, and infill development. In these well-served transit areas, the plan should encourage municipalities to increase the minimum allowable density to seven units per acre and up to fifteen units where appropriate. Additionally, sustained investments will be necessary to improve the capacity and reliability of transportation services and infrastructure.
Areas at high risk of flooding and with potential for smart growth need effective planning that promotes development while protecting communities and infrastructure through flood-resilient design. These regions must balance climate risks with substantial housing growth. To address this, it’s crucial to implement policies that integrate climate resilience with housing. Conducting risk assessments will guide strategic investments in resilient infrastructure, ensuring that funding aligns with the growth and adaptation needs of vulnerable communities.
Municipalities highly exposed to future flooding and with relatively low potential for smart growth may require different strategic approaches, such as managed retreat and reprogramming existing land use to open space and recreational uses, as well as including restrictions on certain types of residential development. Instead of focusing solely on disaster recovery, the new plan should encourage localities to design for long-term adaptation and resilience. Localities should utilize their land use authority to discourage residential development in areas with low growth potential and assist homeowners and renters in relocating away from flood hazards.
Areas with low future flood risk and limited smart growth potential can enhance livability and sustainability through targeted interventions that prevent urban sprawl. By focusing on adaptive reuse and middle-density buildings along existing transit and commercial corridors, these areas can promote mixed-use development and improve connectivity. The best approach is to adopt incremental development at moderate densities, accompanied by gradual improvements in transit.
To achieve the recommendations above, the new plan and related Policy Map should develop a more nuanced framework to integrate Planning Areas and corresponding policies. As currently defined, these are too broad to capture the distinctions between the issue areas examined in this report. Metropolitan Planning Areas (PA1) in particular require policies that better reflect distinctions between residential density, transit proximity, and flood risk.


Conclusion and Next Steps
Conclusion
The analysis of New Jersey’s residential development trends between 2000 and 2020 reveals a period of significant shifts, shaped by the aspirational goals of the 2001 State Development and Redevelopment Plan. While the state made commendable progress in promoting a more compact, smart-growth development pattern, particularly in its metropolitan centers, and limited the loss of open space and farmland, this was accompanied by a substantial statewide underproduction of housing. This imbalance has directly fueled a severe affordability crisis, characterized by critically low vacancy rates and soaring housing costs for both renters and homeowners across the state. Furthermore, despite encouraging growth in transit-proximate housing, many of these areas still lack the density required to fully leverage public transportation infrastructure, indicating a missed opportunity for truly integrated and sustainable communities.
Crucially, this retrospective study highlights the escalating challenge of climate change as significant new residential construction continues in areas highly vulnerable to coastal flooding, even after lessons from events like Hurricane Sandy. The inherent tension between guiding development, addressing housing needs, and mitigating environmental risks became increasingly apparent during this period. The voluntary nature of the 2001 Plan, while fostering some positive shifts, ultimately could not override local land-use regulations or sufficiently incentivize comprehensive solutions to the complex, interconnected issues of housing supply, affordability, transit integration, and climate resilience.
As New Jersey moves forward with the preliminary 2024 State Plan and its ongoing cross-acceptance process, the findings from this 20-year analysis offer invaluable insights. Future planning efforts must transcend broad classifications and adopt a more nuanced approach, particularly for Metropolitan Planning Areas, to explicitly integrate considerations of residential density, transit proximity, and flood risk. By leveraging these lessons, the updated State Plan has a critical opportunity to develop truly effective strategies that ensure sufficient and affordable housing for all New Jerseyans, while simultaneously building resilient communities capable of adapting to the realities of a changing climate.
Next Steps
A second component to this analysis will assess similar trends but as it relates to the third round of affordable housing obligations (2015-2025), under the Fair Housing Act (Mount Laurel Doctrine). As New Jersey confronts ongoing pressures related to housing affordability, climate change, and unequal access to opportunities, the forward-looking goals and policies outlined herein will play a central role in shaping the state’s trajectory over the coming decades.
Methodology & Technical Documentation
-
To analyze development trends based on the 2001 NJ State Development and Redevelopment Plan (particularly the Planning Area boundaries delineated in the 2001 State Policy Map), RPA developed a surface area methodology to classify census tracts by Planning Areas. This methodology calculated the surface area of planning area designations that overlapped with a census tract, and the census tract was classified as the Planning Area that covered the most surface area of such tract.
A supplementary methodology was created to reconcile the discrepancies between the 2010 and 2022 Census Tracts. The 2022 census tracts were used to perform the initial Planning Area classification; however, when spatially joined to the HHUUD10 table in ArcGIS Pro, not all of the census tracts are captured because the HHUUD10 data is aggregated using 2010 census tracts. To identify the Planning Area designation for the 2022 Census Tracts that were appropriately joined to the 2010 Census Tracts, a similar methodology was employed, where the census tract was classified as the Planning Area covering the majority of its surface area. The surface areas could be identified because the majority of the 2022 tracts that were not captured are 2010 census tracts that were often split into two or more tracts.
- Data Sources:
- Spatial Units:
Census Tracts (2010)
Census Tracts (2022)
- Census Tract Counts:
Total Number of 2022 Census Tracts = 2,176
Total Number of 2010 Census Tracts (based on HHUUD10) = 2,004
Total Number of 2022 Census Tracts (null) = 175
-
Based on the Planning Area designations for each Census Tract (2022), we then calculated the number of housing units allocated within each Planning Area for each decade from 1940 to 2020. The number of housing units from 1940 to 2020 is derived from the Historical Housing Unit and Urbanization Database. To further align HHUUD10 housing unit totals with Decennial Census housing unit totals, adjustment factors were calculated for the decades that had differing statewide housing unit count totals between the two data sources. To incorporate 2020 housing unit counts, the adjustment is based on 2019 housing unit counts.
- Data Source:
- Adjustment Factor Calculations:
1980: 2,690,377 / 2,768,939 = 0.97
1990: 3,075,310 / 3,058,353 = 1.01
2020: 3,761,229 / 3,616,614 = 1.04
-
An additional goal of the 2001 NJ State Plan is to inform and encourage the construction of housing typologies appropriate to the different Planning Areas. To understand the degree of influence the Plan may have had, the following analysis identifies the building type of the housing stock of the general time periods that most align with the period before (1980), during (2000), and after (2020) the adoption of the Plan. This analysis identifies both the cumulative and incremental housing stock by building type for 1980, 2000, and 2020 using Decennial Census data.
- Data Source:
- Units:
Building Type
- Notes:
The building types from 1980 were used to keep the categories and analysis consistent across the three time periods (2020 ACS 5 Year Estimates breaks down the housing typologies in greater detail, but 1980 and 2000 Decennial Censuses do not)
- Building Type Classification:
Single Family (detached), Single Family (attached), Middle Density (2-4 units), Multifamily (5+ units) Adjustment Factor of 1.04 is applied to ACS 2020 5-Year Estimates Table DP04 Selected Housing Characteristics because 2020 Decennial Census does not have a designated table with the unit in structure breakdown
The Decennial Census total housing units is derived from “total housing units” not just “occupied housing units”
-
Calculate the overall housing vacancy rate, homeowner and rental vacancy rates for New Jersey State and the top 5 most populated cities/places from 2010 to 2023
Data Source: ACS 1-Year Estimates Table DP04 (Selected Housing Characteristics)
- Geographies:
State: New Jersey
Top 5 Cities/Places: Newark, Jersey City, Paterson, Elizabeth, Toms River CDP
Metropolitan Statistical Areas: Trenton-Princeton, Atlantic City-Hammonton, Vineland
- Housing Vacancy Rates Calculation:
Vacant Housing Units / Total Housing Units) * 100
- Notes:
For 2020 vacancy rates, use ACS 5-Year Estimates
ACS 2023 1-Year Estimates Table DP05 used to identify the top 5 most populated cities/places
ACS 2023 1-Year Estimates Table DP05 used to identify the population for the three Metropolitan Statistical Areas (or NJ Metro Areas)
CDP = Census Designated Places
Rental and Homeowner Vacancy values derived from data table
-
Calculate the typical observed market rate rent for New Jersey State and the top 5 most populated cities/places from 2015 to 4/30/2025, based on Zillow Observed Rate Index (ZORI) Smoothed All Homes Plus Multifamily Time Series ($)
Data Source: RENTALS - Zillow Observed Rent Index (ZORI) Smoothed: All Homes Plus Multifamily Time Series ($)
- Geographies:
Metro & U.S (MSA): New York-Newark-Jersey City NY-NJ-PA
Cities: Newark, Jersey City, Paterson, Elizabeth, Toms River CDP
- Notes:
ZORI data does not come aggregated at the state-level, so New York-Newark-Jersey City NY-NJ-PA is used as the comparable for “New Jersey”
ZORI computes the mean of listed rents that fall into the 35th to 65th percentile range for all homes and apartments in a given region, which is weighted to reflect the rental housing stock
-
Calculate the typical home value and market changes for New Jersey State and the top 5 most populated cities/places from 2000 to 4/30/2025, based on Zillow Home Value Index (ZHVI) All Homes (SFR, Condo/Co-op) Time Series, Smoothed, Seasonally Adjusted ($)
- Geographies:
State: New Jersey
Cities: Newark, Jersey City, Paterson, Elizabeth, Toms River CDP
- Notes:
ZHVI reflects the typical value for homes in the 35th to 65th percentile range
Data goes back to 2000, but the chart begins at 2010
-
Download data here https://rpa.carto.com/tables/hhuud10_rpa_nj/public
Webmap here https://rpa.carto.com/viz/3906cea5-cf33-4f74-9210-18867ada423c/public_map
Land Area
Acres1 = Acres of Census Tract
Acres2 = Acres from sqmi (Square Miles * 640 = Acres)
Density 1
DU_Dn00 = DUs per acre in 2000
DU_DnH0 = Density above 7 DU/Acres (in 2000)
Density 2
DU_Dn20 = DUs per acre in 2020
DU_DnH2 = Density above 7 DU/Acres (in 2020)
Planning Area Designation
- PA_Des1 = Planning Area Designation
0 = Null
1 = Metropolitan
2 = Suburban
3 = Fringe: rural areas (neither agricultural nor environmentally sensitive)
4 = Rural
5 = Environmentally Sensitive
6 = Park
7 = Federal Park
8 = State Park
9 = Meadowlands
10 = Pinelands
11 = Water
42 = Rural Environmentally Sensitive
52 = Barrier Island Environmentally Sensitive
- PA_Des2 = Planning Area Subcategories (high & low based on 7 Du/acre in 2000)
11 = Metropolitan High
12 = Metropolitan Low
- PA_Pro = Planning Area Promoting Growth
0 = None
1 = Promote Growth
2 = Encourage Growth
- PA_Grw = Planning Area Encouraging Growth
0 = None
1 = Promote Growth
2 = Encourage Growth
Housing Change 1 (1980 vs 2000)
DU1_ChN = Net Unit change 1980 vs 2000
DU1_ChP = Percent Unit change 1980 vs 2000
Housing Change 2 (2000 vs 2020)
DU2_ChN = Net Unit change 2000 vs 2020
DU2_ChP = Percent Unit change 2000 vs 2020
Housing Count 3 (Net Number by decade)
DU_80
DU_00
DU_19
DU_20
Flooding
- F_HCat = Hurricane Category (Storm Surge SLOSH / based on centroid)
0 = None
2 = Category 2
4 = Category 4h
- F_AE_Base = FEMA Base Floodplain AE
0 = None
1 = Yes
Transit
T_Zone = Transit Zone (half-mile rail & quarter-mile bus / 33% surface area)
T_Zon_R = Transit Zone (half-mile rail)
T_Zon_B = Transit Zone (quarter-mile bus)
- T_Zon_A = Area in Transit Zone (rail + bus)
T_Zon_AE = Erase
T_Zon_AP = Percent Area in Transit Zone (rail + bus)
- T_Z_Du8 = DUs (1980) in Transit Zone
[DU_80] * [T_Zon_AP]
- T_Z_Du0 = DUs (2000) in Transit Zone
[DU_00] * [T_Zon_AP]
- T_Z_Du2 = DUs (2020) in Transit Zone
[DU_20] * [T_Zon_AP]
- TZ_Ch8A = Incremental DUs (1980-2000) in Transit Zone
T_Z_Du0 - T_Z_Du8
- TZ_Ch8B = Incremental DUs (1980-2000) outside Transit Zone
DU1_ChN -TZ_Ch8A
- TZ_Ch2A = Incremental DUs (2000-2020) in Transit Zone
T_Z_Du2 - T_Z_Du0
- TZ_Ch2B = Incremental DUs (2000-2020) outside Transit Zone
DU2_ChN -TZ_Ch2A
Acknowledgements
Authored by


We express our sincere gratitude to Walter C. Lane and the staff at the New Jersey Office of Planning Advocacy for their insightful review. We’d also like to thank Scott N. Markley, Ph.D., for his guidance on using the Historical Housing Unit and Urbanization Database. We also appreciate RPA staff, both current and former, who contributed their insights and to the production of the report. They include Tom Wright, Kate Slevin, Moses Gates, Sam Bowden, Dave Zackin, Meaghan McElroy, Christina Kata, and Javier Fernandez.
Thank you to the F.M. Kirby Foundation for their support on this report
Funded By
- F.M. Kirby Foundation
Other Reports in this Series
554