
Key Findings
NJ TRANSIT generates $2.5 billion in cumulative annual benefits across the five municipalities we analyzed. Compared with the operating costs, this is almost $5 in economic value for every operating dollar spent.
Projected statewide, NJ TRANSIT produces between $12.7 and 13.8 billion per year.
Service provided by NJ TRANSIT provides $10,100 in annual economic benefits per household in the communities we analyzed. The loss of those benefits would be like a 22–76% increase in rent or 13–40% increase in mortgage costs.
Benefits include reduced congestion, fewer crashes, less pollution, and greater economic competitiveness.
In short, NJ TRANSIT more than pays for itself. For every dollar spent on operations, the system returns four to five times that value in economic, environmental, and social benefits, and serves as essential infrastructure for New Jersey’s mobility, affordability, and resilience.
NJ TRANSIT operates one of the largest public transportation systems in the country. On an average weekday, it moves more than 720,000 people across the state, connecting them to jobs, schools, healthcare, and daily life. Each year, that adds up to nearly 139 million bus trips and over 60 million rail trips, covering more than 2.6 billion passenger miles.
Its scale is hard to overstate: 2,800 buses running on 263 routes, and over 1,100 railcars serving 12 lines. The average bus trip is about 7 miles; rail trips are longer, averaging 26 miles. Transit serves riders across the income spectrum, from under $22,000 in annual earnings for the lowest-income bus commuters to over $185,000 for the highest-income rail riders. Altogether, NJ TRANSIT riders earn over $37 billion in wages and salaries annually.

Even if you don’t use NJ TRANSIT, your friends, neighbors, or co-workers do. And whether or not you realize it, transit plays a vital role in your community and your quality of life. Nearly 9% of commuter trips in New Jersey are by bus or train, and that doesn’t include the many other trips people take to visit loved ones, access essential services, or simply move through their day. Transit is a critical part of how New Jersey moves, and how its economy functions.
To understand just how much it matters, we imagined a future without it; a scenario where NJ TRANSIT is no longer a contributor to New Jersey’s mobility constellation or its economy. We analyzed five representative communities to measure what would be lost in terms of mobility, economic activity, and quality of life. Then we extrapolated those impacts statewide.
The results are stark: without NJ TRANSIT, the state’s road network would need to absorb over 2.5 billion additional vehicle miles each year. Without NJ TRANSIT, there would be gridlock on major corridors, more crashes, increased air and noise pollution, and higher public costs across the board. The loss of mobility could hamstring the state.
How this Report is Structured
This report opens with a statewide snapshot of how people commute, looking at where they live, where they work, and the role that transit plays in connecting the two. We identify the communities and job centers most reliant on public transportation.
Then, we take a closer look at five representative communities, selected not just for their high rates of transit use, but because they reflect different types of places across New Jersey. These cases quantify the value created by transit in each municipality, demonstrating the system’s economic value to the vibrancy of our communities. We then step back out to consider what these local stories tell us about the statewide value of transit.
Population and Demographics: New Jersey
In 2023, New Jersey had 9.3 million residents, making it the 11th most populated state in the country, up from 8.8 million in 2010. The state has an average population density of approximately 2 people per acre. Of the state’s population, 70.4% identify as white, 22.7% as Hispanic or Latino, 15.5% as Black or African American, and 10.6% as Asian.
The median age in the state is 40 years (on par with the US), with 17.7% of the state being older than 65 years old. The median household income is $101,050, and the poverty rate is 9.7% with 28.9% of those living in poverty under the age of 18. The employment rate is 66.2%. The median gross rent in the state is $1,653 and the homeownership rate is 63.7%.
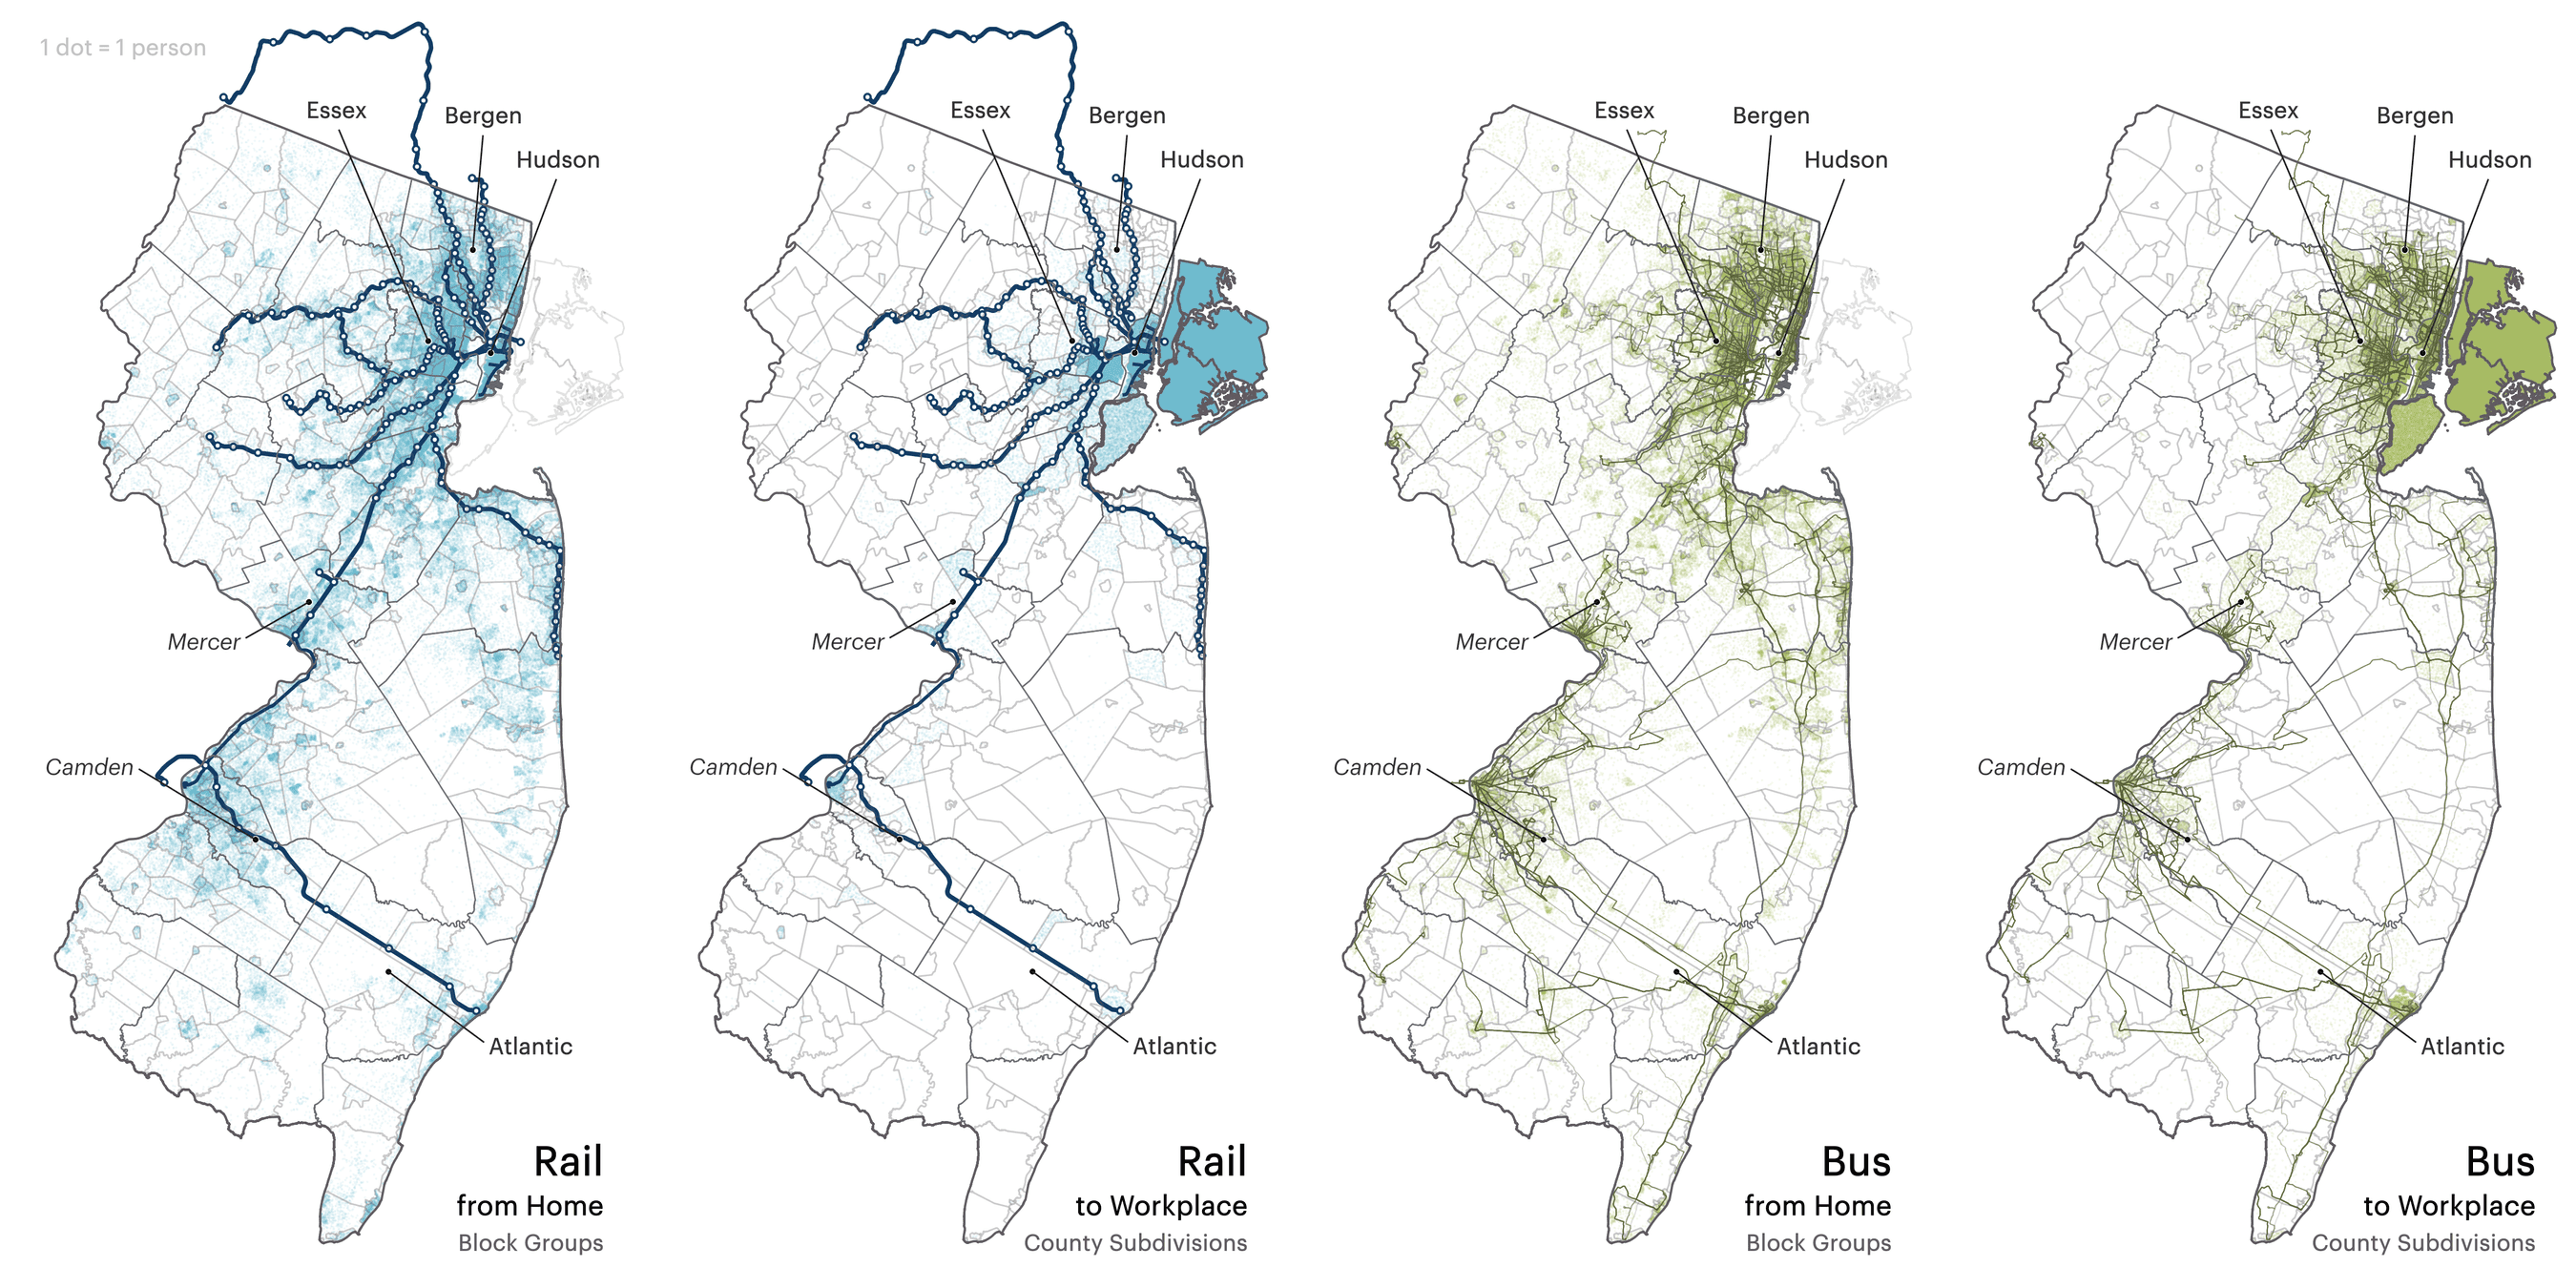
According to the United States Census, 9% of New Jersey commuters get to work by bus or rail. The maps below show where they live, where they work, and how the system collects, concentrates, and distributes them between those locations. While the commute to work comprises only a small proportion of trips–about 20% on average–it is the work commute trip for which we have the most consistent data.
Transit to Work: By Residence and Place of Work
Mode Share in New Jersey
Rail riders, though heavily concentrated in the northeastern part of the state, hail from across New Jersey with significant concentrations distributed throughout. Many are heading to New York City, but a large number also travel to jobs in Essex and Hudson counties.
Bus commuters are similarly concentrated in the northeast, though to a lesser extent than rail riders. There are also significant pockets of bus ridership around Camden and Atlantic City. Given the much greater geographic coverage of the bus system, it is no surprise that there are nearly three times more bus than rail trips.
Regardless of personal resources or use, every resident of and visitor to NJ benefits from the system; each trip taken on NJ TRANSIT represents an important contribution to the economies of the state, its municipalities, and its local communities.
Value of NJ TRANSIT
In this report we look at five representative communities: Atlantic City, Bloomfield, Hackensack, Newark and Union City.
We selected these municipalities because they have higher-than-average transit ridership and represent a range of community types within the state. While there are similarities, each of these communities relies on transit in different ways, and would each experience different harm from the loss of NJ TRANSIT.
We worked with the urban economics consulting firm, Econsult Solutions, Inc. (ESI), to study the social and economic benefits and disbenefits of hypothetical service disruptions. The analysis shows economic gain or loss in each of these communities due to changes in safety conditions, economic competitiveness, environmental conditions, quality of life, and systems operation and maintenance.
We estimate the total annual benefits to the state would be between $12.7 and $13.8 billion. Total net benefits, subtracting operating costs, are $9.84 billion to $10.94 billion.
Categorizing Benefits
Most of the benefits we see accrue to the greater community and some more directly to individuals. In general, community benefits or disbenefits are driven by the amount of vehicle miles traveled (VMT) in different contexts. Benefits/disbenefits come in the form of:
Road Maintenance: when fewer trips are taken in private vehicles there is less wear on road infrastructure. With fewer vehicle miles travelled, municipalities pay less each year on maintenance and repairs, and residents pay less through taxes.
Traffic Congestion: when trips are taken on transit instead of private vehicles congestion is reduced. Across the state 2.6 billion miles are traveled on NJ TRANSIT.
Air & Noise Pollution: our analysis also considers CO2 emissions, EPA criteria air pollutants, and noise pollution. Reduced VMT corresponds to reduced emissions.
Agglomeration Benefits: arise from more compact land use patterns. Compact land use is necessary for shorter trips, more pedestrian and cycling activity, and reduced need for car ownership. These facets have implications to business attraction and productivity, and thus the competitiveness of municipalities, the state and the region.
Crashes: also associated with more or less VMT, measure fatalities and injuries to automobile users, fatalities and injuries to pedestrians and cyclists, and property damage. As VMT goes down with more transit travel, so do injuries, fatalities, and property damage.
Alternative to Car Ownership: residents avoid the cost of owning and operating a vehicle, including the purchase, maintenance, insurance, and gas, which have all risen substantially over the past ten years.
Travel Time: may increase or decrease with mode shifts from transit. Generally speaking, a local trip by car will be faster than the same trip by bus while a long distance rail trip will be slower by car. Hence trips once made by bus that are now made by car may be faster for the traveler, even while all the other trips are slowed due to the congestion impacts. Conversely, a rail rider now driving the same trip may face a slower trip altogether, especially during peak travel times.

Atlantic City is a beachfront community best known as a major tourism and entertainment hub for the state. Atlantic City is thought to be one of the first resort towns on the East Coast with locals from Philadelphia taking the train on the Camden and Atlantic Railroad beginning in the latter half of the 19th century. The city has 38,486 residents living at an average density of 5.6 people per acre.
It is one of the most racially and ethnically diverse cities in the state: 31.8% of residents identify as Black or African American, 32.4% as Hispanic or Latino, 20.6% as White, and 16.2% as Asian. Nearly half of households speak a language other than English at home.
The median age in Atlantic City is 37.8, slightly younger than the state average. About 80.7% of the population is over the age of 16 (29,545), of which 59.1% (17,469) are in the civilian labor force and 87.4% are employed. Of these 15,251 employed residents, two-thirds (64.6%) work within the city proper, while one-third (35.4%) commute elsewhere in the region.
At the same time, around 33,832 jobs are located in Atlantic City. About 29.1% of those are held by city residents, while the remaining 70.9% are filled by workers commuting in—many of whom rely on NJ TRANSIT. That means in addition to the 9,853 residents who live and work locally, another 23,980 people commute into Atlantic City daily, and roughly 5,398 commute out.
While 3,049 residents rely on NJ TRANSIT to get to work, many others, including the 23,235 residents who are not employed or in the labor force, may also depend on transit to meet daily needs.
Car ownership in Atlantic City is notably low: just 364 vehicles per 1,000 residents, which is about half the statewide average, and two out of every five households (41.6%) don’t have access to a car at all.
The median household income is $36,220 with median rent being $1,084 per month, and median monthly costs for homeowners with a mortgage are $1,768.
Atlantic City remains a major tourism and entertainment hub. The arts, entertainment, recreation, and accommodation sector accounts for over a third (36.2%) of local employment, and the city is home to nine casinos.
Atlantic City Employment In-Commuters and Out-Commuters

Public Transportation in Atlantic City
Atlantic City is served by one rail line, the Atlantic City Line, which runs from the eponymous city to Philadelphia. There are 13 bus lines that serve Atlantic City including one express bus to the Port Authority Bus Terminal in Manhattan and one route to Philadelphia. The AC Jitney provides free shuttle transportation between the rail station and the casinos.
Bus Service in Atlantic City
Of the estimated 4.3 million annual rides on NJ TRANSIT to, from and within Atlantic City, 4 million (94%) are on board buses. On an average fall day in 2023, there were 7,278 boardings and 6,992 alightings in Atlantic City. By far, stops near the Atlantic City Bus Terminal were the most active. The 6,603 boardings and alightings here account for almost half (46.3%) of the total of 14,270 in the municipality. Notably, the bus terminal abuts the Tanger Outlets and many hotels and casinos to the south on the boardwalk, suggesting that these high activity bus stops in Atlantic City are vital toward connecting leisure trips and work commutes for riders.
Rail Service in Atlantic City
During the year, there are an estimated 251,331 rides on rail. On an average weekday in FY2024, 498 riders boarded at the Atlantic City Rail Terminal, making it the most active station along the Atlantic City Line (ACL). Across the line, 1,600 passenger trips were completed on average during the same year. In recent years, the terminal and the line are most active from July to September, with an average of 674 boardings and 1,950 passenger trips during that time. Other active stations on the ACL in FY2024 include Philadelphia’s 30th Street Station with 451 average boardings and Lindenwold Station with 175 boardings.

Bus Use in Atlantic City
Commuters in Atlantic City
A plurality of Atlantic City commuters (45%) drive to work alone. Combined, public transportation (21%), walk (16%), and work from home (6%) make up another 43%. The rest carpool (8%), bike (1%), or report using a different mode (taxi, motorcycle, or other). The average commute time is 22.3 minutes.
Women and residents of Hispanic/Latino origin are over-represented among transit riders, meaning they would be disproportionately harmed by service reductions or the loss of transit.
Women in Atlantic City are 36% more likely to use public transportation than men. They make up 54% of transit commuters, despite representing only 48% of the labor force.
These gendered differences in mode choice are likely shaped by structural factors including caregiving responsibilities and access to safe and reliable transportation options. As a result, women may not have the same ability to use another mode when transit is unavailable. Any loss of transit service would therefore have a disproportionate impact on women in Atlantic City.
Hispanic or Latino workers living in Atlantic City depend on public transportation to travel to work nearly as much as driving, with 30% using public transportation compared to 35% driving alone. The Hispanic or Latino workers in Atlantic City represent nearly half (48%) of the municipality’s transit commuters, a factor of almost 2 ½ times their share of the labor force (20%). Hispanic and Latino workers in Atlantic City were more than twice (219%) as likely to use public transportation over other means of transportation compared to non-Hispanic or Latino workers.
Means of Transportation: Atlantic City
Value of Transit in Atlantic City
Public transportation contributes $122.7 million in economic value to Atlantic City and the broader New Jersey economy every year. Bus service accounts for the bulk of that impact, generating $83.9 million annually. After subtracting operating costs of $32.7 million, the net annual benefit totals $89.6 million, meaning that every dollar invested in transit gets a return of $3.75.
And that’s just the part we can quantify. Beyond the economic impact, the loss of transit would likely result in even greater, harder-to-measure consequences that would negatively impact residents’ quality of life. Thousands of riders could lose access to jobs, education, healthcare, and community support systems, compounding existing inequities and straining public resources in other areas.
As shown in the table below, the benefits from reduced air and noise pollution and avoided crashes exceed the cost of providing the service. The other benefits, including reduced road maintenance costs, less congestion, lower emissions, and economic gains from greater agglomeration along with major cost savings for individual riders is all “bonus” value on top of the initial return.
Altogether, losing transit would amount to an economic loss of $5,430 per household each year equivalent to a 42% increase in rent (median rent is $1,084) and a 26% increase in median ownership costs with a mortgage ($1,768).


Nestled just a stone’s throw away from New York City, Bloomfield Township is also considered to be on the inner ring of the Newark suburbs. Bloomfield was originally part of the City of Newark until it was incorporated in 1812. Today, Bloomfield is home to 52,974 residents, with a density of 15.5 persons per acre.
The community is racially and ethnically diverse. Fewer than half of residents (47.4%) identify as white, 28.2% as Hispanic or Latino, 17.8% as Black or African American, and 9.8% identify as Asian. Approximately one third (32.7%) of households in Bloomfield speak a language other than English at home.
The median age is 38.1 years. Nearly 82% (43,925) of residents are 16 years or older, and of that group, 72.4% participate in the civilian labor force. Bloomfield enjoys a healthy employment rate with 93.9% of the labor force employed. Of these nearly 29,875 employed residents, a quarter (25.9%) work within Bloomfield while three-quarters (74.1%) worked in other parts of the region.
There are around 17,645 jobs located in Bloomfield. Just over half (56.2%) of those jobs are filled by people commuting in, 43.8% are held by Bloomfield residents. That means, about 7,731 live and work in the Township, 22,144 commute out, and 9,914 commute in from other municipalities.
While 3,846 residents rely on NJ TRANSIT to get to work, many others, including the 23,099 residents who are not employed or in the labor force, may also depend on transit to meet daily needs.
Car ownership is slightly below the state average with 612 vehicles per every 1,000 residents.
The median household income is $98,811 with median rent being $1,775 per month, and the median monthly homeownership cost for Bloomfield residents who have a mortgage is $3,060.
The largest industry in Bloomfield is educational services, healthcare or social assistance services making up 26% of the jobs.
Bloomfield Employment In-Commuters and Out-Commuters

Public Transportation in Bloomfield
Bloomfield is served by two stations on the Montclair Boonton line. There are 12 bus lines including one express bus, the 102, that runs during the peak period to the Port Authority Bus Terminal.
Bus Service in Bloomfield
Riders in Bloomfield take an estimated 3.1 million trips on buses per year. On an average day between October through December 2023, a total of 5,229 riders boarded and 4,882 deboarded from buses in Bloomfield. The bus stops with the highest usage were located near intersections of Bloomfield Avenue abutted by commercial and institutional uses and within proximity of rail stations. Many of the most active stops surrounded a six-way intersection where Bloomfield and Glenwood Avenues converge with Broad and Washington Streets just west of the campus of Bloomfield College of Montclair State University and north of Watsessing Park. Like many of the study municipalities, high boarding and alighting occurs at transit nodes where there are intermodal connections or opportunities for bus transfers. Much of the bus activity occurs near the Bloomfield and Watsessing stations on the Montclair-Boonton (M-B) line, as well as the Newark Light Rail (NLR) station to Newark Penn Station near Bloomfield Avenue and Grove Street.
Rail Service in Bloomfield
An estimated 682,095 trips occur on rail in Bloomfield per year. At the Bloomfield rail station, there were 1,048 boardings on an average weekday during FY2024. This makes it the second most active station after Bay Street two stations up the line, where 1,089 riders boarded on average. The Montclair-Boonton (M-B) line had 11,850 passenger trips during the same financial year, with the greatest volume of trips from October to December during the second quarter, when 12,250 passenger trips were completed. During this quarter, there were 1,048 boardings at Bloomfield rail station, defining the fall as the most active season for both the station and the line. Recent TOD development around the rail station such as AvalonBay Communities demonstrate how proximity to transit benefits value, development, and use of adjacent land in municipalities like Bloomfield.

Bus Use in Bloomfield
Commuters in Bloomfield
Although the majority of commuters drive alone to work (almost 56%), workers in Bloomfield still have a relatively high dependency on public transportation. 13.3% of residents used public transportation to commute to work as opposed to 9% for the state. The rest carpool (8.6%), walk (3.2%), and just 1% take a different mode. At 18.1% of employees, Bloomfield’s residents work from home at a rate double the state’s average. The average time it takes to get to work is 33.6 minutes.
Though Hispanic and Latino workers make up 13% of the labor force in Bloomfield, they make up 27% of transit commuters, a share twice (201%) as large. They are 31% more likely to use transit than Non-Hispanic and Latino workers. Similarly, though Asian workers make up 5% of the labor force, they make up 11% of transit commuters. They are 15% more likely to use transit than non-Asian workers.
Means of Transportation to Work: Bloomfield
Mode Share in Bloomfield
Value of Transit in Bloomfield
Public transportation contributes $129.2 million to Bloomfield and the NJ economy every year.
That’s the part we can quantify. As with Atlantic City, losing transit could easily cost more and adversely impact thousands of riders in potentially intangible ways.
The net annual economic benefit of the NJ TRANSIT service in Bloomfield is $97.3 million dollars. The total benefit of $129.2 million is offset by an estimated operating cost of $31.4 million suggesting a $4.10 return on every dollar spent to provide the service.
As with the Atlantic City case, the collective advantage of transit, i.e. the benefit of reduced road maintenance, reduced traffic congestion, and reduced air and noise pollution plus the agglomeration benefits, exceeds the operating costs. The substantial individual benefits in reduced cost of crashes, car ownership cost savings, and travel time benefits, totaling $91 million, are all upside.
Rail contributes to the majority of the value from carbon emission reduction. For all transit services within Bloomfield, carbon reduction benefits represent 4.47% of the value. However, for rail services in Bloomfield, carbon reduction represents 15.72% of the total value generated. Rail accounts for 88.7% of the value of CO₂ emission reductions in Bloomfield.
The annual loss of economic value per household would be $4,720 in Bloomfield, equivalent to a 22% increase in rent (median rent is $1,084) and a 16% increase in median ownership costs with a mortgage ($3,060).

Value of NJ TRANSIT per Year in Bloomfield

Image by Famartin
Situated at the cusp of the Meadowlands, the City of Hackensack is the most populous in Bergen County and serves as the county seat. The City is home to 45,768 people, living at a density of 17.1 persons per acre.
36% of Hackensack residents identify as Hispanic or Latino, 36.7% as white, 20.7% as Black or African American, and 12.1% identify as Asian. A majority of households (51.5%) speak a language other than English at home.
The median age in Hackensack is 41.5 years. About 86.5% of residents are over the age of 16 (39,581), and 69.7% of that group is in the civilian labor force (27,600), with 93.5% of them employed—just higher than in New Jersey overall.
Of its 25,796 employed residents, over a quarter (27.86%) work within Hackensack while three quarters (72.14%) of residents work elsewhere in the region. Of 38,698 jobs in the municipality, one in five (18.57%) is filled by a resident while the others (81.43%) are filled by commuters from outside of the municipality. Thus while 7,187 commute within and 18,609 commute out of Hackensack, there are 31,511 commuting into the city.
While 3,348 residents rely on NJ TRANSIT to get to work, many others, including the 19,972 residents who are not employed nor in the labor force, may also depend on transit to meet daily needs.
Of over 26,000 households in Hackensack, 2,822 lack access to a vehicle – or 1 out of every 7 households. Within the municipality, there are 572 vehicles per every 1,000 residents.
The median household income is $82,212, with gross median rent being $1,794 per month and for those with a mortgage, the median monthly ownership cost is $2,879.
Hackensack Meridian Health is one of the largest employers in northern New Jersey, with over 36,000 employees. The health system’s hub is located in Hackensack with an ER, hospital, and primary care facilities located within the city.
Hackensack Employment In-Commuters and Out-Commuters

Public Transportation in Hackensack
Hackensack is served by one rail station on the Bergen line. There are 18 bus lines including 6 that serve Manhattan.
Bus Service
An estimated 4,630,824 trips to or from Hackensack are completed on buses each year. During a fall day in Q2 FY2024, there were 7,572 total boardings and 7,910 alightings from buses within Hackensack. About a fifth (21.87%) began or ended at Hackensack Bus Terminal, where the 1,619 boarding and 1,767 alighting allowed access to the commercial center along Main Street, the Bergen County Justice Center, and the business center Court Plaza. Adjacent to Hackensack University Medical Center, stops at Essex St and Summit St had 5% of boardings and alightings. Other active stops are near the USCIS Application Support Center and an industrial complex past the I-80 Express that includes the Amazon Fulfillment Center EWR8.
Rail Service
Hackensack involves an estimated 133,657 trips each year on rail. The Pascack Valley line had 4,350 weekday trips on average FY2024. During that year, 191 passengers boarded at Essex Street each weekday, 234 passengers boarded at Anderson Street, and 329 boarded just north of Hackensack at New Bridge Landing. All three of these rail stations remained busy throughout the year, consistently averaging 760 - 775 weekday boardings from September through March (Q2-Q4 FY2024), but had 700 boardings during that summer (Q1 FY2024).

Bus Use in Hackensack
Commuters in Hackensack
In Hackensack, the majority of commuters (61%) drive alone; 13% take public transit, 11% work from home, 7% carpool, 5% walk and fewer than 1% bike, and 3% take some other mode (taxi, motorcycle, etc.). On average, it takes commuters living in Hackensack 27.5 minutes to get to work.
Though the 2,282 workers identifying as Asian represent only 8% of Hackensack’s workforce, they represent 17% of its transit commuters. That’s more than twice their representation in the labor force, making them the most overrepresented transit commuters. Asian workers in Hackensack are 38% more likely to use public transportation over other means of transportation compared to non-Asian workers.
Means of Transportation to Work: Hackensack
Mode Share in Hackensack
Value of Transit in Hackensack
Public transportation contributes $165.1 million to Hackensack and the New Jersey economy every year. As with the other cases, losing transit could easily cost more and adversely impact thousands of riders in potentially intangible ways.
The net annual economic benefit of the NJ TRANSIT service in Hackensack is $131.8 million dollars.
The total benefit of $165.1 million is offset by an estimated operating cost of $32.7 million, suggesting a $5.04 return on investment for every dollar spent to provide the service. Bus operations provide the lion’s share of benefit at 96% of net benefits.
In Hackensack, the benefits of avoided crashes and reduced congestion alone exceed the operating costs. The substantial, remaining collective and individual benefits totaling $100 million, are all upside.
Like larger cities we studied, agglomeration benefits from transit are also important to Hackensack. Agglomeration benefits make up more than 16% share of the total benefits in Hackensack.
The annual loss of economic value per household in Hackensack would be $8,130, which is equivalent to a 38% increase in rent (median rent is $1,794) and a 23% increase in median ownership costs with a mortgage ($2.879).

Value of NJ TRANSIT per Year in Hackensack
Value per Year by Transit Mode in Hackensack

The City of Newark is New Jersey’s largest city, home to a population of 307.188 residents living at a population density of 19.9 people per acre. Newark is known for its rich history in the jazz scene and its diverse cuisine, especially Portuguese food in the Ironbound neighborhood. It’s also a major economic engine for the state, home to major employers such as Anheuser-Busch, PSEG, Audible, and several institutes of higher education.
46.7% of Newark residents identify as Black or African American, with 37.2% identifying as Hispanic or Latino, about 16.5% identifying as white, and 1.9% identifying as Asian. Roughly half of Newark residents speak a language other than English at home.
The median age is 34.8 years old, substantially lower than the state median. Nearly 78.1% of the population is over the age of 16 (239,845), and 61.9% of that group participates in the civilian labor force (148,561). The employment rate among those in the labor force is 89.1%.
Of 132,414 employed residents, 42.1% work within the city proper while 57.9% commute to jobs in other parts of the region. Of 174,918 jobs in Newark, 31.9% are filled by residents, the other 68.1% are filled by commuters from outside the city. That amounts to roughly 55,755 Newark residents who live and work in the city, 76,659 who commute out, and 119,162 who commute in.
While 23,586 residents rely on NJ Transit to get to work, many others, including the 174,774 residents who are not employed or in the labor force, may also depend on transit to meet daily needs.
Car ownership in the city is limited; 1 out of every 3 households reports not having access to an automobile. Within the municipality there are 345 vehicles per every 1,000 residents. Like with Atlantic City, this is about half the state average.
The median household income is $48,416 with the median gross rent in the city being $1,330 per month. The median monthly costs for Newark residents who have a mortgage is $2,553.
Newark’s largest employment sector is the educational services, health care, and social assistance industry, which employs 20.7% of the population.
Newark Employment In-Commuters and Out-Commuters

Public Transportation in Newark
Newark has a robust commuter rail system supported by NJ TRANSIT and serves as a critical hub for the system. The City is directly served by 6 of the agency’s 10 commuter rail lines. Newark Penn Station connects to the North Jersey Coast Line, Northeast Corridor, and the Raritan Valley Line. Newark Broad Street Station serves the Gladstone Branch, Morristown Line, and the Montclair-Boonton Line.
In addition to its commuter rail, Newark is a key hub of the PATH system , which provides frequent service through Jersey City and Manhattan, ending at the World Trade Center, as well as connections to Hoboken Train Terminal. Within the city, Newark’s light rail system operates along two service routes within a single network. One connects the city’s two major train stations and the Performing Arts Center, while the other stops at key destinations including NJIT and Branch Brook Park before terminating in Bloomfield. There are dozens of intrastate bus lines that serve the City of Newark as well as three routes that serve the Port Authority Bus Terminal.
With two major rail stations, a light rail line, PATH access, and an extensive local bus network, Newark is a critical hub in the daily operations of NJ TRANSIT, acting as both a major destination and as a central transfer point for tens of thousands of riders each day.
Bus Service in Newark
In Newark, there are an estimated 51,212,179 trips on buses each year. During a typical fall day in FY2024, there were 87,421 boardings and 90,931 alightings. The highest volume of boardings and alightings is concentrated at the commercial city center. Along Broad Street near the Military Park Light Rail Station, 13,885 boardings and 16,111 alightings occur during a typical fall day, making up over a sixth of those in the municipality (17.70%). The 6,920 boarding and 5,665 alightings at the underpasses and plazas that flank Newark Penn Station make up 7.43% of the total.
Rail Service in Newark
Rail service allows 7,119,046 passenger trips to be completed in Newark each year. In FY2024, there were 15,597 passenger boardings on an average weekday. From October to December that year (Q2 FY2024), average weekday boardings increased to 16,106. NJ TRANSIT rail lines crossing the state converge at Newark, including the Northeast Corridor on which 81,300 passenger trips occurred on average in FY2024, North Jersey Coast Line with 14,600 trips, Raritan Valley Line with 13,550 trips, and the Atlantic City Line with 1,600 trips.
Bus Use in Newark

Commuters in Newark
The most frequently used mode to work for Newark commuters is drive alone comprising a plurality of 50%. The other half take public transportation (19%), carpool (11%), walk (5%), use other modes (9%), or work from home (6%). Newark has the longest average commute time among the study municipalities at 31.2 minutes.
Black or African American workers are overrepresented on transit by over double (210%) of their share of the labor force. While they comprise 27% of the labor force, they account for 56% of transit riders. Black workers in Newark were 87% more likely to use public transportation than non-Black workers.
Means of Transportation to Work: Newark
Mode Share in Newark
Value of Transit in Newark
Public transportation contributes $1.72 billion to Newark and the New Jersey economy every year.
As with the other cases, losing transit could easily cost more and adversely impact thousands of riders in potentially intangible ways.
The net annual economic benefit of the NJ TRANSIT service in Newark is $1.4 billion dollars. The total benefit of $1.72 billion is offset by an estimated operating cost of $326.2 million, suggesting a $5.27 return on investment for every dollar spent to provide the service. Bus operations provide the lion’s share of benefit at 97% of net benefits.
In Newark, the benefits of reduced air and noise pollution, congestion and road maintenance exceed the operating costs by over $50 million. The substantial, remaining benefits totaling more than $1B, are all upside.
Among the municipalities we studied, Newark experiences the best return on operating costs for NJ TRANSIT. The ratio of benefits to costs is 5.12 in Newark, compared to 4.83 for all five municipalities.
The annual loss of economic value per household in Newark would be equivalent to $15,120, which is equivalent to nearly doubling (+95%) the median rent ($1,330) paid over a year ($15,960) or adding another half (+49%) of the median ownership costs with a mortgage ($2,553) paid over a year ($30,636).

Value of NJ TRANSIT per Year in Newark

Union City is one of the most densely populated cities in the country with a total population of 66,375, living at a density of 80.4 people per acre. Perched atop the palisades and overlooking Weehawken, Hoboken, and the Manhattan skyline, the city is adjacent to The Heights in Jersey City and serves as a key residential hub within the region.
The city’s population is predominantly Hispanic or Latino, with 81.6% of residents identifying as such. About 25.8% identify as white, 4.7% as Black or African American, and 4% as Asian.
The median age is 37.8 years and 81.0% of the population is over the age of 16 (53,739). Of that, 68.2% are in the civilian labor force (36,668) and 91.5% of the labor force is employed. Among these 33,540 employed residents, 18.9% work within city limits, others commute to jobs elsewhere in the region.
Union City has about 16,938 jobs, roughly 37.3% of which are held by city residents, while 62.7% are filled by workers commuting in. That equates to about 6,324 residents who live and work locally, 27,216 who commute elsewhere, and 10,614 who commute into the city from other parts of New Jersey.
While 11,488 residents rely on NJ Transit to get to work, many others, including the 32,835 residents who are not employed or in the labor force, may also depend on transit to meet daily needs.
In Union City, 2 out of every 5 households do not have access to an automobile. There are only 307 vehicles per 1,000 residents.
The median household income is $65,369 with gross median rent being $1,489. The median monthly costs for Union City residents who have a mortgage is $3,055.
Union City’s largest employment sector is the educational services, health care, and social assistance industry, providing jobs for 17.7% of the population.
Union City Employment In-Commuters and Out-Commuters

Public Transportation in Union City
Union City is not served by NJ TRANSIT Rail. There are 32 bus lines including 23 that serve the Port Authority Bus Terminal.
Bus Service in Union City
Bus trips in Union City are estimated at 9,614,163 a year. Although Union City is a relatively small municipality by area, there are 16,837 boardings and 14,985 alightings on a typical fall day in FY2024. A quarter (26.33%) of these occur at stops along Bergenline Avenue between 29th and 34th Street, where 4,338 trips began and 4,042 ended. Further beyond at 49th Street, there are about 1,100 boardings and alightings (5%) at the Bergen Line Avenue station of the Hudson-Bergen Light Rail.
Rail Service in Union City
An estimated 1,466,909 trips are taken on light rail each year in Union City. During FY2024, there were 24,912 trips taken on the Hudson-Bergen Light Rail on an average weekday. Over the course of a year, the service allows passengers to travel 59.7 million miles through 14,823,161 trips. This is 60% of the passenger-miles and 68.6% of trips on all NJ TRANSIT’S light rail services.

Bus Use in Union City
Commuters in Union City
Private automobiles are the most common travel mode for the Union City labor force: 42% commute by car, 32% drive alone. Rare among US cities, more people in Union City take public transportation to work (35%), than drive alone. Just over 11% of the City’s employees walk to work; 10% carpool, 3% take other means such as taxi or scooter, 7% work from home. Union City commuters have the second highest average work commute time of the five study communities, clocking in at 30.5 minutes.
Hispanic or Latino workers, who make up nearly three-quarters (73%) of public transportation commuters, comprise only 42% of the labor force making them 3 ¾ more likely to be on transit than their non-Hispanic/Latino counterparts.
Like Atlantic City, Union City has a clear gender gap in commuting choices. Of transit commuters, 55% are women. Of the labor force, only 47% are women. The share of transit commuters who are women is thus 116% their share of the labor force, with further disparity on the Hudson-Bergen rail (129%). Women are 83% less likely to bike and 26% less likely to walk. By contrast, men are 54% more likely to drive.
Means of Transportation to Work: Union City
Mode Share in Union City
Value of Transit in Union City
Public transportation contributes $393.6 million to Union City and the New Jersey economy every year.
As with the other cases, losing transit could easily cost more and adversely impact thousands of riders in potentially intangible ways.
The net annual economic benefit of the NJ TRANSIT service in Union City is $291.5 million. The total benefit of $393.6 is offset by an estimated operating cost of $101.2 million suggesting a $3.89 return on investment for every dollar spent to provide the service. Bus operations provide the lion’s share of benefit at 97% of net benefits.
In Union City, the benefits of reduced air and noise pollution, plus agglomeration benefits exceed the operating costs. The substantial, remaining benefits totaling more than $180 million are all upside.
The $394 million in economic benefits from NJ TRANSIT, if divided across Union City’s households, would be $15,138 per household per year.
The loss of this value would be equivalent to an 18% rent increase from the median ($1,489) and 9% increase to median ownership costs with a mortgage ($3,055). The $3,923 benefit per household from the reduced travel time alone in Union City is extraordinarily over 148% of the benefit per household among all five municipalities ($2,654.89).
The $32 million disbenefit from carbon emissions would cost Union City’s 25,782 households $1,255 each year, equivalent to a 7% rent increase from the median ($1,489) or 3.42% increase from median ownership costs with a mortgage ($3,055).

Value of NJ TRANSIT per Year in Union City
Together, these five municipalities represent about 5% of the state’s population. The value of NJ TRANSIT service in just these five communities is close to $2.5 billion in value each year. When projected statewide, the value ranges between $12.7 and $13.8 billion per year.
Summary of Mode Share
These benefits are not limited solely to riders. A loss of transit would certainly mean that riders would lose access to their jobs and other activities; employers would also lose access to a larger labor pool, and streets would become more congested as transit trips shift to private vehicles. Many of those trips would occur on roads already operating at or near capacity, compounding existing delays and increasing traffic-related costs. The rise in car travel would lead to increased air pollution and greenhouse gas emissions, with disproportionate impacts in densely populated areas.
To estimate the range of value NJ TRANSIT contributes to the state, we applied the average benefit cost ratio to the 2024 annual operating budget. This provides the upper bound of the estimate. The lower bound is created by weighting the benefit cost ratio by the population of transit commuters.
Value of NJ TRANSIT

State Extrapolation
Conclusions
Based on our analysis of the five municipalities, we estimate that the system currently generates $2.5 billion in net annual benefits within the five case study municipalities alone — returning close to five dollars in value for every dollar spent on operations. When extrapolated statewide, our analysis suggests that NJ TRANSIT contributes between $12.7 and $13.8 billion in annual economic benefits to New Jersey.
Ultimately, a hypothetical future without NJ TRANSIT would result in an average per household loss of $10,100 in economic and social value each year. The loss is equivalent to a 22% to 76% increase in the median rent, or a 13% to 40% increase in median home ownership costs. The impacts of service cuts would have ripple effects that would be felt across income levels, and its impact would burden areas well outside the service areas.


Related Reports
555