
Key Findings and Best Practices
Key Findings
- We looked at 18 income based reduced fare programs across some of the largest cities and transit agencies in the United States, 14 of which have a higher income threshold requirement than the baseline 130% Federal Poverty Level (FPL).
- Enrollment across many programs is low, with seven case study examples showing highest program participation rates at 50%.
A series of best practices, detailed below, aid several programs with addressing outreach and enrollment gaps.
Some programs have sought to investigate connections between transit affordability and health, which in the case of the MBTA’s program, led to the establishment of a reduced fare discount for riders, though the topic of health benefits across programs is largely unexplored.
Best Practices from Existing Reduced Fare Programs
Implement Wider Eligibility Thresholds to Reach More Riders: broadening income thresholds to a higher percentage of the federal poverty rate can qualify a greater number of people who struggle with transportation cost burdens but are excluded from limited income eligibility requirements.
Ease Processes Through Auto Enrollment and Auto Qualification: automated processes for registering people into programs eases the application constraints that prohibit enrollment.
Utilize Community Based Organizations (CBOs) to Reach Eligible Riders: partnerships with community-based organizations can address communication gaps between agencies and underserved communities who face barriers to enrollment.
Employ More Dynamic Outreach Efforts: implementation of multiple and creative methods of outreach can help further disseminate program information among eligible populations.
Evaluate Fair Fare Programs’ Effects on Community Health and Wellbeing: collaborative work between public transit agencies and research organizations can reveal potential health impacts and benefits of reduced fare programs.
The intent of this research is to demonstrate the value of reduced and free fares for health equity and show how these programs are being implemented across the several U.S. regions, but it does not attempt to evaluate how to weigh these benefits against costs, or the challenges and successes of broad-based fare reduction as opposed to targeted means-tested programs.
Most programs have eligibility requirements for reduced fare rates, age thresholds for youth and seniors, student status, military service, physical disabilities, or income level. Most programs also require applicants to prove residency of the municipality, county, or state that the corresponding transit system is based in. Income thresholds specifically are one of many criteria within a single program and, in some cases, are a recent addition to programs that have already existed for seniors, youth, people with disabilities, or other disadvantaged riders. Income thresholds vary program to program and are typically based on a percentage of the national federal poverty level (FPL). A higher percentage of the FPL widens the pool of eligible applicants, like in Los Angeles County where the maximum annual income limit for one individual is $53,000. It’s also important to note that in high-cost-of-living states like New York, the current Fair Fares eligibility requirement of 150% of the FPL is still quite poor and often includes those who are not regularly employed. Lifting the eligibility threshold would not only capture more people but it would especially capture more working people.
Though these criteria can overlap (low-income seniors, veterans with disabilities), this paper outlines programs with income-based components as this factor is a direct connection to cost barriers for low-income riders.
Reduced Fare Transit Programs Across the United States
(that list income as an eligibility criteria)
*multiple transit systems. Depending on the transit system, LA LIFE discount packages and deals range.
Free Bus Programs Across the United States
*Based on 2023 data from the Federal Transit Administration’s (FTA) National Transit Database (NTD) of Transit Agency Profiles.
To address the issue of transit affordability, cities across the U.S. have implemented free or reduced fare transit programs to improve the mobility and accessibility outcomes of their riders. Some places have even made buses completely free–Ulster County, NY; select routes in Boston; a free bus pilot in NYC. Reduced fare transit programs have existed in the United States since the early 2000s, but the impact of the COVID-19 pandemic, which led to decreased ridership on public transit systems, saw an increased interest and action in the rollout and expansion of new and existing programs in several cities across the country in an effort to get people back on public transit. The implementation of reduced fare programs is one step towards health equity as it lowers a barrier of access–cost–resulting in the possibility of transit connections to destinations beyond one’s neighborhood for low income residents in their respective cities and regions. This ability to pay for public transit at a discounted cost through reduced fare programs allows people to access things that positively influence their health, like food, clinics, family, friends, public and open spaces.

Ulster County Area Transit (UCAT) has made bus service free in Ulster County, NY. The UCAT bus pictured is traveling through the village of New Paltz.
AEMoreira042281, Wikimeda
The establishment of reduced fare and fareless programs in such a variety of America’s urban, rural, and suburban regions is a necessary and hopeful step towards health equity for transit riders, and a sign that governments and transit agencies see the benefit of cost-effective fares for low-income populations. Even more so, it’s critical that these programs are accessible so that low-income residents of their respective municipalities can reap the benefits of access to jobs and services. What’s important is that people are enrolled in and using these programs to get to social services, health care appointments, recreational activities, so that positive outcomes for health and wellbeing can be realized.
The true value of these programs for individual and community public health is the recognition that transit is a resource that should be available to as many people as possible.
Conversations with stakeholders and experts in a few cities revealed that initiatives can often be structured as “free if you have a job,” indicating availability primarily for the “deserving poor,” which can mean that specific low-income populations, like students or seniors, must too often have to choose between “a meal or a metro card.” BIPOC, ELL, or undocumented residents in particular face historic and structural barriers that put them at a disadvantage when it comes to sufficient income, vehicle ownership, and resource access. There are also newly arrived immigrant or refugee communities in some places who are unable to obtain driver’s licenses and experience barriers that are different from someone who was born in the U.S. or is familiar with American bureaucratic processes. Layered upon the monetary costs, there is a level of stress that is induced from balancing these challenges with the ability to move to and from critical destinations without feeling overwhelmed by the cost of mobility.

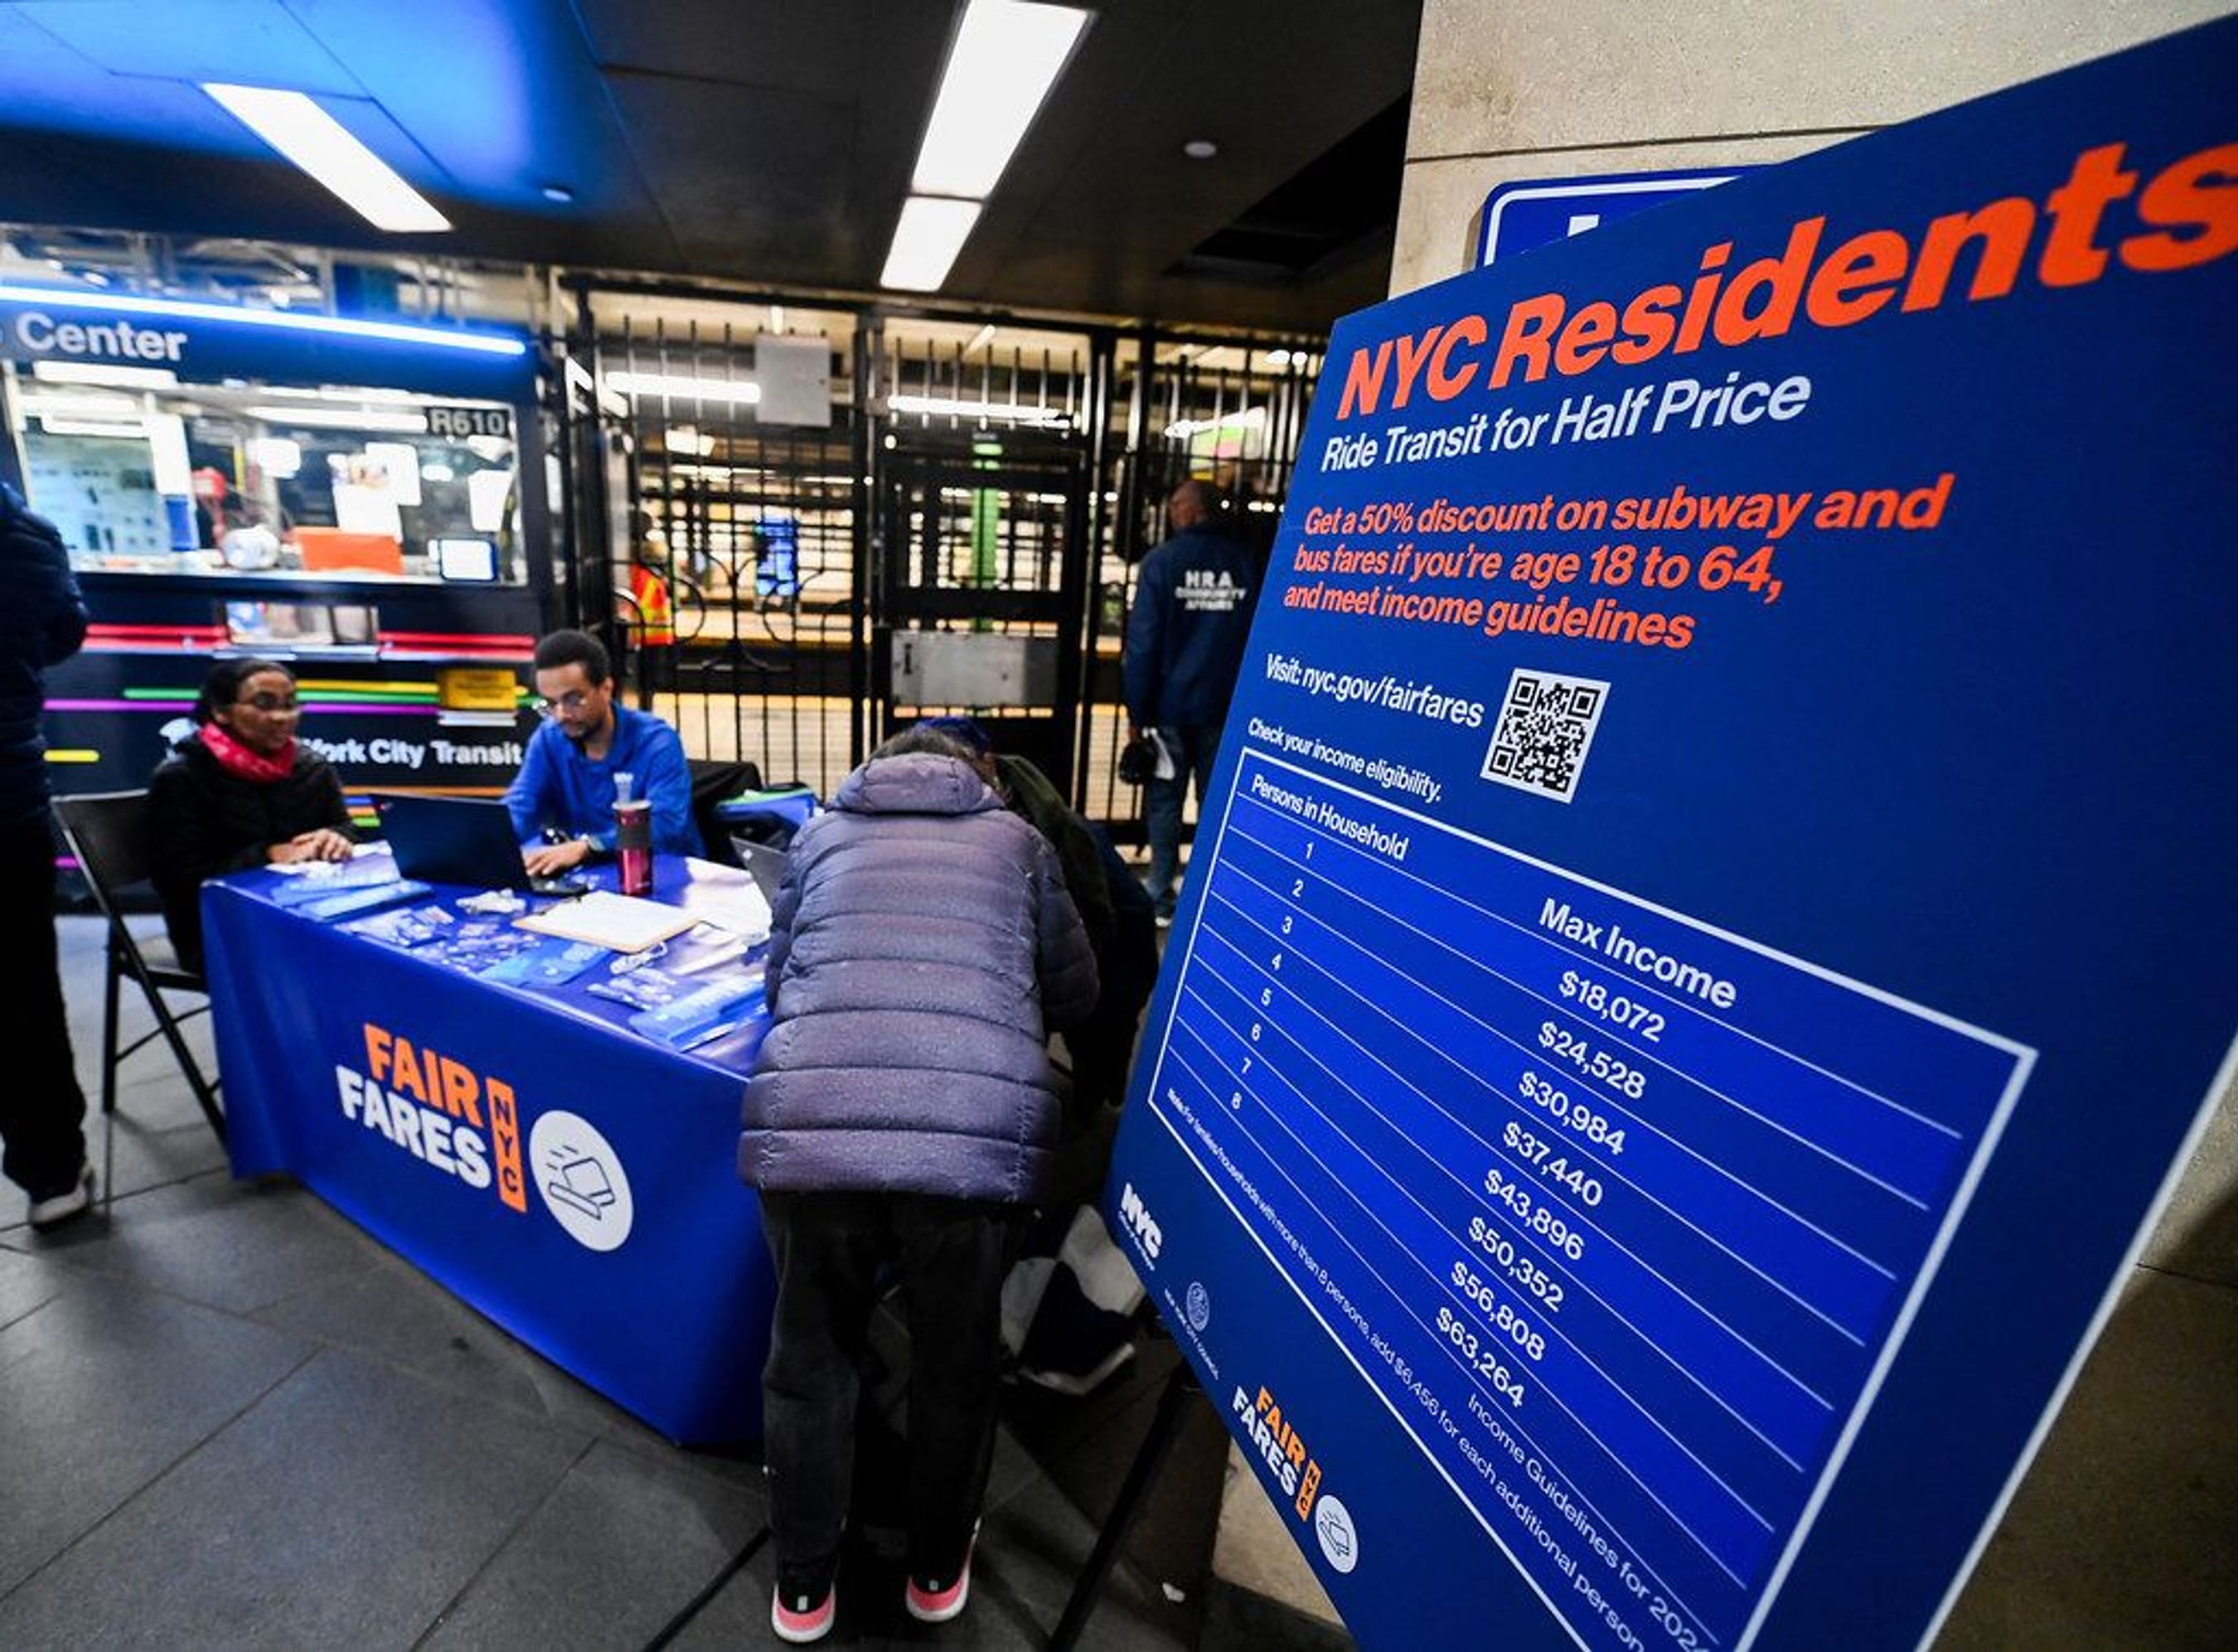
An issue in New York and many other cities is that only a fraction of the people who qualify for reduced fare programs are enrolled. Fair Fares NYC has one of the higher enrollment rates (39.9%) compared to other programs, but still, two thirds of eligible New Yorkers do not take advantage of transit discounts that are available to them. There are a number of issues cited in existing studies that result in low enrollment including lack of public awareness, strenuous application processes, exclusion of commuter railroads like LIRR and Metro North, and limited eligibility thresholds. While not an exhaustive list, these represent some of the most significant and addressable barriers of the many challenges with enrollment.
Calculations for this chart are based on the number of people living in the counties included in each program’s service area (see Table 3 for details on counties). The number of households qualifying by income (based on program annual income thresholds) was divided by the total number of households within the program service geography (counties). See Table 3 contents and citations for further information on data sources and methodology.
These issues do not go unrecognized by those working on reduced fare programs across the U.S. Interviews conducted with advocates, transit workers, and experts from reduced fare programs reveal the creative processes that support outreach and enrollment. The seven programs detailed below were chosen based on three criteria: geographies represented in the Healthy Regions Planning Exchange (LA, Portland, Pittsburgh and the Twin Cities), programs with income thresholds ≥130% of the FPL and ≥50% discount on fare, and the ability to have direct conversations with program stakeholders that informed the secondary research.
There is no single antidote to completely fulfilling enrollment targets–the case studies discussed have incorporated multiple creative tools into various aspects of outreach and administration. This research sought to center the impact of reduced fare programs on health and well-being, but along the way, revealed more about what these programs are doing to better reach and serve impacted populations, efforts that ultimately better the health of communities that rely on public transit in these regions.
Implement Wider Eligibility Thresholds to Reach More Riders
Eligibility thresholds tend to fall somewhere around the thresholds used for SNAP/WIC/EBT enrollment (130% of the FPL), but a number of programs, LA LIFE, Twin Cities TAP, Honored Citizen, and the MBTA Income Eligible Reduced Fare Program, go beyond this maximum to account for localized poverty rates and average incomes. Program expansions can vary, but the positive outcome is that more people who would benefit from and qualify for a reduced rate can become technically eligible for their municipality’s respective program.
Ease Processes Through Auto Enrollment and Auto Qualification
Auto enrollment based on participation in government programs like SNAP/EBT/WIC would remove the barrier of filling out an application, saving qualified riders the time and stress of navigating application processes, digging up old documents, or finding the time in their schedules to visit/call service centers for application assistance. Auto qualification, as a second option, is also based on participation in government programs, but because there is no guaranteed existence of government agency, public assistance program, and transit system/administering entity collaboration, this type of enrollment mechanism does require some action on the part of the applicant. Still, it is much less complicated than applying from scratch, as less documentation, particularly proof of income, is needed.
Programs that are currently employing auto enrollment
SEPTA’s Zero Fare Program is limited in the population it serves with a target of 25,000 residents randomly selected from 18-64 year olds living in Philadelphia who make under $23.4k annually. But the program is hailed as particularly unique for its auto enrollment mechanism that saves eligible participants from having to go through the application process. SEPTA even goes the extra mile to mail enrollees their activated Zero Fare Key cards.
Programs that are currently employing auto qualification (or considering it)
With the Allegheny Go program, applicants are eligible for this reduced fare program if they or their children have access to SNAP benefits. Given the SNAP auto qualification, applications do not require a social security number. Potential reduced fare riders input their SNAP identification numbers to register. As of 2024, enrollment numbers in this program are low despite auto qualification. According to advocates at Pittsburghers for Public Transit, the low enrollment rate reflects a combination implementation challenges such as the fact that the program was initially launched only though a mobile app, preventing users without access to smart phones to use the program. While a card-based version of the program became available in April 2025, inadequate marketing of these improvements and the fare program overall has likely contributed to low enrollment numbers.
Honored Citizen employs a similar method with auto qualifiers through the recognition of 10 social programs that have similar income thresholds limits, including SNAP, Federal Pell Grants, unemployment benefits, and the Oregon Health Plan, which is Oregon’s state medicaid program. If a person can show they are enrolled in these programs, they can qualify for a reduced fare. The two biggest income qualifiers used by applicants to enter into Honored Citizen are SNAP and the Oregon Health Plan. Each makes up roughly 35% of submitted applications, which is a little more than 70% of all applicants combined.


At King County Metro, administrators have the ability to see people’s current income through enrollment in other programs like SNAP and WIC. The County also employs Community Transportation Navigators (CTN), some of whom are specifically healthcare navigators that can help applicants with enrollment. SNAP users just have to present their ID and administrators can get them enrolled. Having a range of administrators with experience in different issues (health care, housing, food access) also creates a one stop shop for multiple types of assistance.
In the Twin Cities, auto qualification is being seriously considered. There is a bill currently moving in the session trying to identify a pilot that will remove existing administrative barriers for TAP applicants by integrating TAP applications within the Minnesota Benefits portal (where residents apply for social services like SNAP). These efforts are supported by groups like Second Harvest Heartland, Nourish MN Coalition, and Move Minnesota Action who also work on housing and food security issues.
Utilize Community Based Organizations (CBOs) to Reach Eligible Riders
A major barrier to program enrollment and to awareness that a program exists has to do with reaching specific and individual communities, building trust, and engaging multiple issues areas, which requires the recognition of transit as a need and mechanism in an ecosystem of resources and rights (shelter, food, medicine). Partnership with CBOs that have existing relationships with different residents in a program’s geographic area can allow for that program’s reach to extend beyond what program administrators alone are able to achieve.
LA LIFE began CBO partnerships in 2021 through a Request for Proposals (RFP) for contracted services, two years after the program was rolled out. Roughly one year later, in January 2022, LA Metro reported to have hired 24 community-based organizations to assist with the distribution of program materials across the County. LA Metro’s update to the Board of Directors in August of ‘22 cited several successes with new partnerships: “as a result of CBO efforts, 19 outreach events were held, 2,000 individuals were reached, and 165 enrolled.” Alongside a partnership with the Department of Social Services (DPSS), an additional 13,000 new candidates were enrolled into the program. LA Metro also welcomed new partnerships with Legacy LA and Los Angeles Metropolitan Churches, organizations that can help reach residents on the Eastside, South Los Angeles, and Inglewood.

At the Honored Citizen program in Portland, partnerships with CBOs, a network of organizations filled with people eager to help others in the area, have been charted as a success. When the program first started, partnering non profits were on contract with TriMet and had specific benchmarks to retrieve sign ups at a number of different places. Program administrators found that too restrictive for how they wanted to work with their partners and how their partners worked with communities. The three person outreach team at TriMet saw a vision for working with community groups that centered a network of support that met people where they were– and community representatives with pre-existing connections to residents were trusted by program administrators to pursue their own methods for engagement.
Honored Citizen has since switched to a grant program for fare grants and enrollment partner grants. This new structure distributes around $4M worth of grant funding to over 150 local non profits and an additional 60 enrollment partners in different areas that can assist with application screening and enrollment so that residents don’t necessarily have to apply directly through TriMet. TriMet also partners with government entities, schools, and public libraries for outreach, enrollment, and administration. Overall, this new approach gives flexibility to partners on how they want to conduct outreach and engage in their communities: places of worship, door to door in apartment buildings, etc.
As many of these organizations already have relationships in the community, they may have access to materials and dialogues that TriMet does not, particularly among immigrant groups, undocumented residents, or groups whose native language is not English. A big challenge that the program faces with getting people to apply has to do with the demographics that they work with: unhoused individuals, immigrants, refugees–it can be difficult for these residents to prove income or have the right documentation, which is why collaboration with CBOs like Rosewood Initiatives, IRCO, and the Afghan Support Network is critical to reducing those barriers. Honored Citizen doesn’t require enrollees to have United States citizenship, which allows for international students, immigrants, and visitors to benefit from the program. The connection to health care organizations is also important, given the auto qualification connection, which is why Honored Citizen also partners with certain community groups that have access to healthcare services and information that can help with enrollment to Medicaid and SNAP.
Employ More Dynamic Outreach Efforts
Using a variety of outreach methods can broaden awareness of a program’s existence. Awareness is the first step in program participation, but not everyone is consuming information in the same way or from the same places. With non-English speaking communities, informational material with limited language alternatives creates a barrier. An app or digital ad might not reach seniors or low-income people without smart phones and personal computers.
Evaluate Fair Fare Programs’ Effects on Community Health and Wellbeing
Studies and initiatives that explore connections between reduced fare or fareless transit programs and positive health outcomes are limited. In terms of the impact of these programs on ridership overall, it’s hard to measure accurately because of the many compounding factors, from poor quality and expensive housing to poor air quality and environmental hazards, that are concentrated in low-come communities. Frankly, not everyone is thinking about health impacts in a direct way–initiatives are not always publicized as intersecting with health equity, but it’s important to acknowledge that more information and research on the health benefits of reduced fares can create opportunities for program permanence and expansion and introduce this type of programming in places where reduced fares have not yet been established. Despite the lack of clear and comprehensive long term assessments for reduced fare program impacts on health, there are case studies to draw from, particularly with Boston and Portland’s research, and ways in which the health issue is acknowledged and addressed indirectly through partnerships, paratransit, and other initiatives.

Access-a-Ride is the MTA’s paratransit service
The Importance of Paratransit
Several programs cited their accompanying paratransit services as essential to health services for riders with disabilities. Twin Cities’ Metro Mobility provides free door to door service for certified riders. In Portland, the LIFT program also meets riders at their doorstep and even delivered groceries during COVID. MBTA’s the RIDE and NYC’s Access-A-Ride are similar programs. Though paratransit services can be limited in the population served or available routes and times for service, they are an essential resource for a subset of the population that already experiences issues with limited mobility and pre-existing health conditions, thus their connection to health outcomes is clear and direct. Beyond connecting folks to health care, paratransit has shown to help older adults with social connectivity, alleviating the harsh impacts of isolation and loneliness.
Connection to People and Places Also Means Food, Job, and Healthcare Access
Access to transit is access to people. People use transit to attend recreational and social events. Taking transit in and of itself can be a public health benefit if you’re an older adult or if the weather is bad. Some people need to go to the doctor or the hospital, others need an affordable way to reach groceries. With participation in a program like Honored Citizen, the monthly cost for transit goes from $100 to $28, which is money that can be used for food, medicine, or other essential goods.
Many programs work to administer, enroll, and perform outreach to eligible riders in partnership with public health agencies or food advocacy groups. Honored Citizen, for example, engages with healthcare partners, schools, and women’s shelters. Allegheny Go’s rollout had strong ties to organizations in Pittsburgh that focus on transit access and food justice as overlapping issues, particularly for low income and immigrant communities. The 2024 press announcement for the program featured advocates from Just Harvest and the Food Policy Council alongside Pittsburghers for Public Transit.
Existing Studies on Reduced Fare Transit and Health Outcomes
Honored Citizen and MBTA Reduced Fares have both published research in collaboration with academic institutions investigating the question of health and social wellbeing impacts and outcomes as a result of income based reduced fare transit discounts.
MIT’s 2019 study, “How Low-income Transit Riders in Boston Respond to Discounted Fares: A Randomized Controlled Evaluation,” came before the rollout of the MBTA Reduced Fares in 2024 and informed the approach to the MBTA’s program. The study took place over three months, included 240 participants living in Boston, and compared trip frequency and behavior among two groups: those enrolled in a 50% fare discount and those who paid full price for fares. The research found that participants with a 50% off discount took 30% more trips than those without a discount, particularly during off peak times. Reduced fare riders also took more trips to health care and social service destinations or to go shopping and run errands. The results from this evaluation led to the establishment of MBTA’s Income-Eligible Reduced Fare Program which launched in 2024.
In the Puget Sound, TriMet’s Honored Citizen staff worked alongside Portland State University to explore the impact of low income transit fare programs on riders in “Do Travel Costs Matter For Persons With Lower Incomes?” Researchers interviewed 20 low income riders and surveyed 118 total TriMet riders, 98 of whom identified specifically as low income riders. Low income riders reflected that they were able to use TriMet services to access “community events/groups, healthcare, work and school.” In the qualitative interviews with low income groups, one rider reported using the bus to travel to their mental health group. Others reported that having the discounted rate encouraged them to leave the house more, some used their pass to travel to green spaces. Low income riders also reported cost savings, with one person mentioning that they used the extra room in their budget to purchase better quality food.
Comparisons Among Select Reduced Fare Programs
-
- “Funding” column:
- numbers that are not footnoted otherwise were provided through primary stakeholder interviews.
- Estimated funding for the Allegheny Go program is based on the target number of eligible riders multiplied by the figures provided in “Low-income Alleghany County residents can ride public transit for half price starting in June” – 1.2M for every 10k users.
- “Estimated number of qualifying households based on income” column:
- information is based on average household size for the program’s geography multiplied by income limit based on household size. Most households had an average of 2-3 persons per household. Household size averages were sourced from the U.S. Census Bureau’s 2023 1-Year Estimates American Community Survey, Table S1101, “Households and Families.”
- Income limit for each program was measured by totalling up the number of households in all counties within the program geography earning equal to or less than the income limit for the program based on household size.
- Income data was sourced from the U.S. Census Bureau’s 2023 1-Year Estimates American Community Survey. Table S1901, “Income in the Past 12 Months (in 2023 Inflation-Adjusted Dollars).”
- ”Number of people eligible for program” column:
- Estimations for LA LIFE are based on the number of eligible households multiplied by average household size. The average household size in LA County rounded to the nearest whole number is 3. The number of eligible households is 1,518,207. Methodology inspired by Urban Institute’s Participation rates of income-based, discounted fare programs map and PCAC’s methodology for determining eligible population with % FPL increase in Expanding Fair Fares to 200% of the Federal Poverty Level.
- The number of people eligible for TAP is based on information from “Metro Transit’s Transit Assistance Program Benefits.” For ORCA LIFT, estimates are based on information from “Sound Transit Board formally adopts $1 ORCA LIFT fares.” 84k people are identified as 80% of the likely market, making 100% of the likely market roughly 105k people.
- ”Number of people enrolled” column:
- The estimated number of people enrolled in LA LIFE is based on information from “Response to Motion 48: Enhancing the Effectiveness of the LIFE Program.”
- The estimated number of people enrolled in Allegheny Go is based on “Allegheny Go Program: Interactive Dashboard.”
- The estimated number of people enrolled in the MBTA Income Eligible Reduced Fare Program is based on information from “‘It’s Good Savings’ – Over 13,000 Riders Are Already Benefiting From Reduced Fare CharlieCards.”
- “Funding” column:
Conclusion
It is clear that equitable access to transportation is not merely a matter of convenience—it is a critical factor in promoting public health, economic opportunity, and social inclusion. It is imperative to support policies and programs that enable affordability for all transit riders. Without intentional investment in our transit systems, marginalized communities will continue to be disproportionately burdened by limited mobility, reduced access to jobs and healthcare, and social isolation. We must prioritize the needs of all people and champion programs and infrastructure that supports opportunity and dignity for all.
Acknowledgements
Authored by


Support for this research was provided in part by the Robert Wood Johnson Foundation. The views expressed herein do not necessarily reflect those of the Foundation.
Header image: “Fair Fares Day of Action” by Metropolitan Transportation Authority, CC BY 2.0
Related Reports
554