Every three years, New York City and the United States Census Bureau conduct a study of housing condition called the Housing and Vacancy Survey. Initial results from the 2017 survey were recently released and can be found here. RPA analyzed the data and found three key takeaways that anyone who cares about affordable housing should read. This is the third and final post in this series.
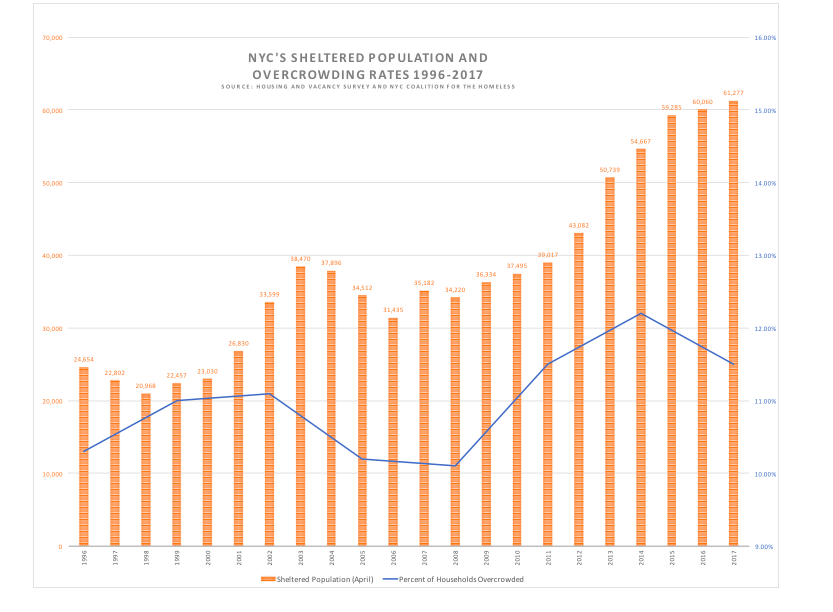
The overall rates for crowing and severe crowding are showing signs of decline—a positive sign that more people are living in healthier, less stressful homes. But this is not necessarily a sign that housing conditions are improving for all. Looking at the trends of homeless and overcrowding rates there is a loose, but still significant, correlation: when crowding rates rise, homelessness generally falls; and when crowding rates fall—as they did between 2014 and 2017---homelessness generally rises.
RELATED: Rental Vacancies Are On The Rise, But Prices Are Out of Reach For Most
Overcrowding is often the first sign of housing instability, a pit-stop on the path towards homelessness. When people are evicted or priced out of their homes they often end up on the couches or floors of friends or relatives—causing overcrowded conditions. When this temporary situation is no longer a viable option, they end up in shelters. So while this 3 years period has seen improvements in the overcrowding rate, the dramatic rise in homelessness (7,000 more people per night from April 2014 to April 2017) is likely the corresponding data point.
And this doesn’t mean that crowding rates are satisfactory—they are still at the second-highest rate since 1960, and tens of thousands of households continue to suffer from the negative effects of overcrowding.

Chart: Homelessness Rents Crowding 2017 (Correlation = .67)
