Lessons Learned
- The public-transit customer experience should extend beyond the environment under transit agencies’ control to include the surroundings encountered when walking or biking to transit stations.
- Dramatically changing institutional structures can be beneficial at times, but is often disruptive and takes time and energy better devoted to improving service. Another approach is to adopt new systems and strategies incrementally, for example on a new line or for a new set of assets rather than simultaneously on an entire transit system.
- Involving the private sector can help agency raise upfront cash, complement public agency skills and insulate the public sector from politically difficult situations. The public sector should set the goals and closely monitor its private partners.
- Building the environmental and economic case for public transportation by developing new metrics is critical to ensuring that government continues to fund transit adequately.
- The key to building public support for increasing fares is to address larger urban goals including livability, the environment, public safety, customer convenience and economic value. Branding and good design in physical settings and in advertising are essential for building positive customer perceptions of transit.
- Diversified revenues are critical to ensuring the long-term stability of transit agencies. Value capture – secured via land values, property taxes, development fees, payroll taxes, parking fees, etc. – works best for entrepreneurial agencies and when it is clear that transit will improve the area. Agencies more dependent on government subsidy are least likely to be able to leverage this type of funding.
Having a smaller setting gives you a chance to have more in-depth discussions with people and to hear their experiences…this kind of exchange, to closely connect with people, that’s a key opportunity from TLS.”
![Summits](https://img.imageboss.me/general/width/300/quality:80/work/Reports/Archive-Featured-Reports/Transit-Leadership-Summit/Summits.png?bossToken=16d9a75accbc5b0b1a0036410fe2e4295241f3a4885e90476ef47a4213459376 171w, https://img.imageboss.me/general/width/600/quality:80/work/Reports/Archive-Featured-Reports/Transit-Leadership-Summit/Summits.png?bossToken=a4943c91406841042abba5b4660b86e2f7cc7a92d006d9b91fc923351a1b63ce 343w, https://img.imageboss.me/general/width/900/quality:80/work/Reports/Archive-Featured-Reports/Transit-Leadership-Summit/Summits.png?bossToken=926242c62a01bcfd4103eac387a55b05e90c5222a7e1d1ce321e5006f12de48b 514w, https://img.imageboss.me/general/width/1200/quality:80/work/Reports/Archive-Featured-Reports/Transit-Leadership-Summit/Summits.png?bossToken=dc3838a5c70c31ecb6d5a4331942ded8f7b5ffa1b8340f23b891e42d26870b0b 686w, https://img.imageboss.me/general/width/1500/quality:80/work/Reports/Archive-Featured-Reports/Transit-Leadership-Summit/Summits.png?bossToken=0e16ad35a3557ced0334123c2dad13a9edca68b0e6d4951db0b2019796e2e4de 857w, https://img.imageboss.me/general/width/1800/quality:80/work/Reports/Archive-Featured-Reports/Transit-Leadership-Summit/Summits.png?bossToken=6ce4f502311f34a77fa99bb0bbda8e311e517b3fd544ddb818ee3ce0d44d5906 1029w, https://img.imageboss.me/general/width/2100/quality:80/work/Reports/Archive-Featured-Reports/Transit-Leadership-Summit/Summits.png?bossToken=de0122c40866f7b30add9e34692d5a701e027dc339f8710c6f5aa0cc4090dd96 1200w, https://img.imageboss.me/general/width/2400/quality:80/work/Reports/Archive-Featured-Reports/Transit-Leadership-Summit/Summits.png?bossToken=43088ff50c71977751bffed1084e4ade2e211d5fe8975823fd9b43b6c50bafc1 1371w, https://img.imageboss.me/general/width/2700/quality:80/work/Reports/Archive-Featured-Reports/Transit-Leadership-Summit/Summits.png?bossToken=1aba05044d37ff96514d1e3404cd310a3d169b2ea4e4b70afa823f87e6492223 1543w)
Regional Plan Association convened three multi-day summits in New York, Singapore and London that have brought together more than two dozen transit executives from 17 different metropolitan areas. This section encapsulates three years of research and conversations that have sought to address the management, operational, governance and planning challenges that many transit systems face daily.
In the full report, each TLS event is summarized, including key details on the venues, activities and discussions.
It was fascinating to see how similar many of our transit challenges ultimately are.”
![TLS Cities World Map](https://img.imageboss.me/general/width/300/quality:80/work/Reports/Archive-Featured-Reports/Transit-Leadership-Summit/TLS-Cities-World-Map.png?bossToken=a761780ff40a33a03b3fa9e1deed00a3defbdad5cf1f4a668f1a79588e534b20 171w, https://img.imageboss.me/general/width/600/quality:80/work/Reports/Archive-Featured-Reports/Transit-Leadership-Summit/TLS-Cities-World-Map.png?bossToken=847f65ad0748032d597233f222909d3fc00da1bb71d35d8217490fb8ee1521a9 343w, https://img.imageboss.me/general/width/900/quality:80/work/Reports/Archive-Featured-Reports/Transit-Leadership-Summit/TLS-Cities-World-Map.png?bossToken=497085181e33c2854addb33a1436518df2494330c264feaf53056328d6044510 514w, https://img.imageboss.me/general/width/1200/quality:80/work/Reports/Archive-Featured-Reports/Transit-Leadership-Summit/TLS-Cities-World-Map.png?bossToken=db5651de2b016c1d3caf9c8570cd287edff45c4649142778edb1486f026a6eca 686w, https://img.imageboss.me/general/width/1500/quality:80/work/Reports/Archive-Featured-Reports/Transit-Leadership-Summit/TLS-Cities-World-Map.png?bossToken=9ac96fed713f50c18c9267f15b2d9b2ef1fbef2ae8e5c93e0ff3a196d03cfedc 857w, https://img.imageboss.me/general/width/1800/quality:80/work/Reports/Archive-Featured-Reports/Transit-Leadership-Summit/TLS-Cities-World-Map.png?bossToken=87925d92343d9a828a10f3ef924db856daf32c6c6024342fcb37ca91d925a17f 1029w, https://img.imageboss.me/general/width/2100/quality:80/work/Reports/Archive-Featured-Reports/Transit-Leadership-Summit/TLS-Cities-World-Map.png?bossToken=2468119414b67be9c0d8abb804ff558f650c365ce2d69e75e1151b6bb9115309 1200w, https://img.imageboss.me/general/width/2400/quality:80/work/Reports/Archive-Featured-Reports/Transit-Leadership-Summit/TLS-Cities-World-Map.png?bossToken=933fcab2bcd1a5c03b10946e2af88dcf0e22d7ba1a3e65600504167463ade088 1371w, https://img.imageboss.me/general/width/2700/quality:80/work/Reports/Archive-Featured-Reports/Transit-Leadership-Summit/TLS-Cities-World-Map.png?bossToken=44fffd7773dee1d0e2d48b254037486cbcdf24c0a03c644017b6538c551630c1 1543w)
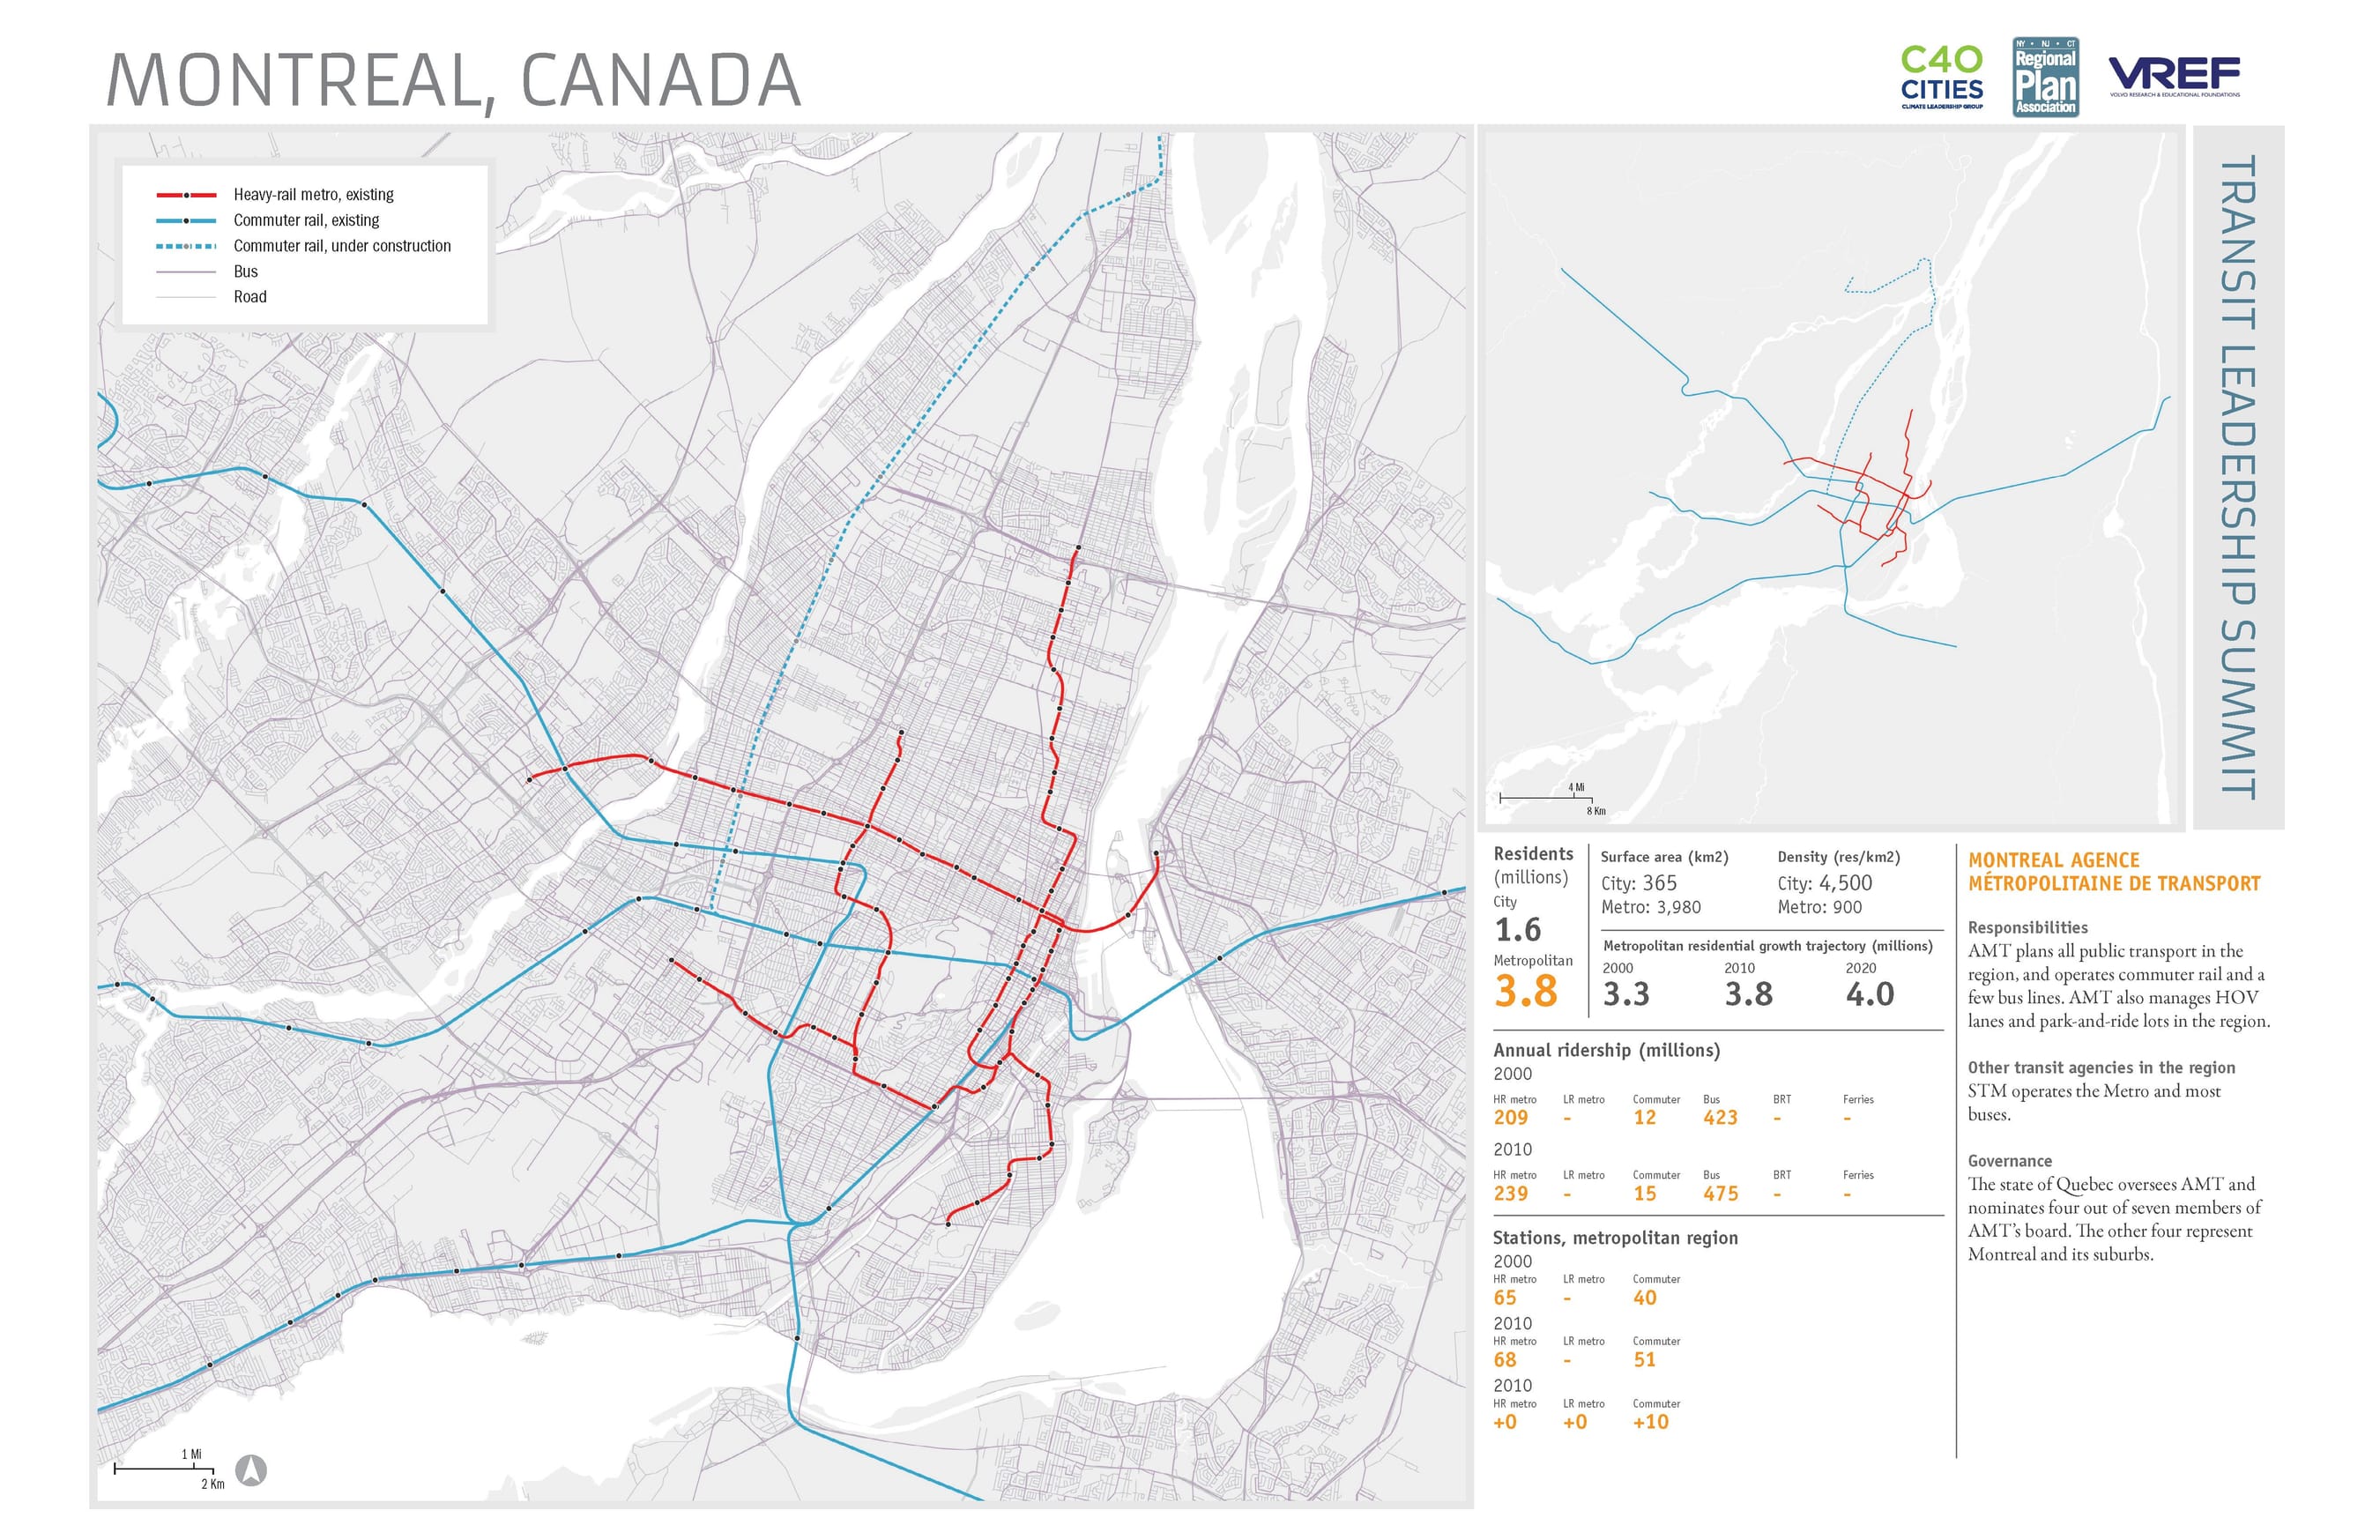
City profiles were developed for each of the 17 TLS cities. The profiles include an overview of the metropolitan area and background on their transit systems, including select innovative actions taken by the transit properties which they have shared at past summits. While the profiles highlight the geographic diversity of the participating cities, they also clearly show that the majority are large metropolitan areas with extensive heavy rail systems.
TLS was a unique opportunity to develop a set of comparative statistics for the participating cities and their transit systems. Over the years RPA staff has updated these data through collaborations with the 17 cities and publicly available sources. This process has revealed difference in how data are defined and interpreted. For instance, agencies define ridership, costs and subsidies in various different ways. In some cases ridership includes all trips separately (unlinked trips) whereas others define a trip as the complete journey even if it includes multiple modes (linked trips). Operating costs can include long-term liabilities, such as pension and asset depreciation costs, or not. Annual formula-based subsidies also could cover capital needs or just the operating deficit. This makes creating valid “apples to apples” comparisons between cities difficult.
Metro Statistics
Mode Share and Ridership
The modal splits show the proportion of transit riders that use each of the transit modes – light rail, heavy rail metro, commuter rail, bus, BRT and ferries. It highlights the variation of the mode share across the 17 TLS cities. It is important to consider modal share in the context of absolute ridership, since modal shares don’t reflect the magnitude of riders on each system. Consider Singapore and Seoul: the two cities appear to be alike, with similar modal splits between heavy rail and light rail. Yet Seoul’s ridership levels are three times greater than those of Singapore.
- A heavy rail metro system typically carries passengers within the city on an exclusive grade-separated right-of-way, elevated viaduct or embankment, subterranean tunnels or an open cut. Trains run frequently throughout the system, stations are spaced more closely together and speeds are slower than commuter rail. Journey times range from 15 to 30 minutes on average.
Examples: New York City subway; London Underground. - A light rail metro system typically runs along surface streets, in some cases in mixed traffic, or on exclusive lanes. Light rail systems generally operate at lower speeds, can brake faster to avoid conflicts with pedestrians, have a lower capacity and are less expensive to build and maintain.
Examples: Hudson-Bergen Light Rail; Wiener Linien (Vienna) - A commuter rail system typically transports residents from far-flung suburbs to the major job centers in metropolitan areas. Commuter trains run faster than heavy and light rail systems, rely on schedules and make less frequent stops.
Examples: Long Island Rail Road; Metrolink (L.A.) - A bus rapid transit (BRT) system aims to provide high-quality surface transportation service similar to that of a rail network. Essential to its success are an exclusive right-of-way, off-board fare collection, platform-level boarding, and improved service plans. A BRT system may adapt some or all of these features depending on its urban context, leading to a range of BRT services worldwide.
Examples: Los Angeles, Santiago
The six white papers focus on pressing issues that transit executives are grappling with on a daily basis or that will affect their longer-term capital decision making. At the heart of each white paper is consideration of the role of the institutions that govern the delivery of transport service, and how these interact with public and private stakeholders. The composition of the transit organization and its operating environment dictate how it will respond to the challenges it faces. Some transit organizations are ill equipped to address broader issues of funding or climate change due to their narrow operational mission, while others are embedded in government and must contend with a political agenda that can result in suboptimal operational decision making.
Improving the Customer Experience
A survey of customer amenity improvements highlights global best practices, such as communicating with customers through social media and analyzing smart card swipes in real time.
![WP Customer Experience 6 C8 A1610 by Transport for London](https://img.imageboss.me/general/cover/300x300/fp-x:0.5,fp-y:0.5,quality:80/work/Reports/Archive-Featured-Reports/Transit-Leadership-Summit/WP-Customer-Experience-6C8A1610-by-Transport-for-London.jpg?bossToken=80a01ab246825edd1b02de7f455920f2784b35d990878fccc1cbceb3d4aa6109 171w, https://img.imageboss.me/general/cover/600x600/fp-x:0.5,fp-y:0.5,quality:80/work/Reports/Archive-Featured-Reports/Transit-Leadership-Summit/WP-Customer-Experience-6C8A1610-by-Transport-for-London.jpg?bossToken=a537d1325576480c673a2615201c34a5a9bfae8ec47f44d029cc72c6d92e7354 343w, https://img.imageboss.me/general/cover/900x900/fp-x:0.5,fp-y:0.5,quality:80/work/Reports/Archive-Featured-Reports/Transit-Leadership-Summit/WP-Customer-Experience-6C8A1610-by-Transport-for-London.jpg?bossToken=84a1ebe2141d51a98e17f9217417c413418564f7c5a10ccda45466c1c409689d 514w, https://img.imageboss.me/general/cover/1200x1200/fp-x:0.5,fp-y:0.5,quality:80/work/Reports/Archive-Featured-Reports/Transit-Leadership-Summit/WP-Customer-Experience-6C8A1610-by-Transport-for-London.jpg?bossToken=f9d4f5fa909d1e642ecf6cf62d6dbf5952eacad246fc3b0acb441a2d9ab7abb1 686w, https://img.imageboss.me/general/cover/1500x1500/fp-x:0.5,fp-y:0.5,quality:80/work/Reports/Archive-Featured-Reports/Transit-Leadership-Summit/WP-Customer-Experience-6C8A1610-by-Transport-for-London.jpg?bossToken=5040a9bca84bbfb58a76623ec9ecf7e9eafe9d91e11fd4005f7843c694399200 857w, https://img.imageboss.me/general/cover/1800x1800/fp-x:0.5,fp-y:0.5,quality:80/work/Reports/Archive-Featured-Reports/Transit-Leadership-Summit/WP-Customer-Experience-6C8A1610-by-Transport-for-London.jpg?bossToken=766cb85d3d4490955052b29419e80c4649dff69d67f5ea09d93e8101028cdd07 1029w, https://img.imageboss.me/general/cover/2100x2100/fp-x:0.5,fp-y:0.5,quality:80/work/Reports/Archive-Featured-Reports/Transit-Leadership-Summit/WP-Customer-Experience-6C8A1610-by-Transport-for-London.jpg?bossToken=b2e7432f5d39284c58b3141b94da75cb3e16cc3f1583a5d9df9eb9e54e02ac3f 1200w, https://img.imageboss.me/general/cover/2400x2400/fp-x:0.5,fp-y:0.5,quality:80/work/Reports/Archive-Featured-Reports/Transit-Leadership-Summit/WP-Customer-Experience-6C8A1610-by-Transport-for-London.jpg?bossToken=f4aaa71aacbdfc296cc9623f56e973ce1983c17ea37d94a246b82a0408a89841 1371w, https://img.imageboss.me/general/cover/2700x2700/fp-x:0.5,fp-y:0.5,quality:80/work/Reports/Archive-Featured-Reports/Transit-Leadership-Summit/WP-Customer-Experience-6C8A1610-by-Transport-for-London.jpg?bossToken=fa8f4bcee367a85217432e8b5be3d421125c58b953eda1d0d99211074666315d 1543w)
Fare Collection and Fare Policy
A study on new fare collection technologies reveals the opportunities for more equitable and flexible fare policies. These technologies make it easier to set and collect fares.
![WP Fare Collection Flickr CC 8327067261 Sha Tin by Tom Page](https://img.imageboss.me/general/cover/300x300/fp-x:0.5,fp-y:0.5,quality:80/work/Reports/Archive-Featured-Reports/Transit-Leadership-Summit/WP-Fare-Collection-Flickr-CC-8327067261-Sha-Tin-by-Tom-Page.jpg?bossToken=580cf61476baf6d5c2bacb2af417b93a09de6527906511b8307a6cb94c79fef1 171w, https://img.imageboss.me/general/cover/600x600/fp-x:0.5,fp-y:0.5,quality:80/work/Reports/Archive-Featured-Reports/Transit-Leadership-Summit/WP-Fare-Collection-Flickr-CC-8327067261-Sha-Tin-by-Tom-Page.jpg?bossToken=7294eb3fd391d9a9b2667dbeb887a8d65a33654ff25686ac922cf1ea9f2be17a 343w, https://img.imageboss.me/general/cover/900x900/fp-x:0.5,fp-y:0.5,quality:80/work/Reports/Archive-Featured-Reports/Transit-Leadership-Summit/WP-Fare-Collection-Flickr-CC-8327067261-Sha-Tin-by-Tom-Page.jpg?bossToken=a04649c2acf9067b6659210d42220645d4797141e38edd5d9a6a8e35457ba3f3 514w, https://img.imageboss.me/general/cover/1200x1200/fp-x:0.5,fp-y:0.5,quality:80/work/Reports/Archive-Featured-Reports/Transit-Leadership-Summit/WP-Fare-Collection-Flickr-CC-8327067261-Sha-Tin-by-Tom-Page.jpg?bossToken=0f516eb7fcb0f241a422711077d1b9df634c5e4f679a1b17d7f6f230e813126a 686w, https://img.imageboss.me/general/cover/1500x1500/fp-x:0.5,fp-y:0.5,quality:80/work/Reports/Archive-Featured-Reports/Transit-Leadership-Summit/WP-Fare-Collection-Flickr-CC-8327067261-Sha-Tin-by-Tom-Page.jpg?bossToken=85c562322e66acb39730cc423a553a8e6c920ee171be5936e58e152e309da85a 857w, https://img.imageboss.me/general/cover/1800x1800/fp-x:0.5,fp-y:0.5,quality:80/work/Reports/Archive-Featured-Reports/Transit-Leadership-Summit/WP-Fare-Collection-Flickr-CC-8327067261-Sha-Tin-by-Tom-Page.jpg?bossToken=9e9777c4aed96bd8d3551846addf8978aca4e58b650e89d535d2eed6318e23d9 1029w, https://img.imageboss.me/general/cover/2100x2100/fp-x:0.5,fp-y:0.5,quality:80/work/Reports/Archive-Featured-Reports/Transit-Leadership-Summit/WP-Fare-Collection-Flickr-CC-8327067261-Sha-Tin-by-Tom-Page.jpg?bossToken=f0761f8de658689bc761f5122c61f5e0a387877dc13fcf2233483dffafa7ed98 1200w, https://img.imageboss.me/general/cover/2400x2400/fp-x:0.5,fp-y:0.5,quality:80/work/Reports/Archive-Featured-Reports/Transit-Leadership-Summit/WP-Fare-Collection-Flickr-CC-8327067261-Sha-Tin-by-Tom-Page.jpg?bossToken=35d281bd92c8e6ad65e4cfeaeeb8cd93268f0fbffbf06401e65292a054a015fc 1371w, https://img.imageboss.me/general/cover/2700x2700/fp-x:0.5,fp-y:0.5,quality:80/work/Reports/Archive-Featured-Reports/Transit-Leadership-Summit/WP-Fare-Collection-Flickr-CC-8327067261-Sha-Tin-by-Tom-Page.jpg?bossToken=0c2216b9402ec6c0a01e71ba8cc4c70772ee8b6d5721c684202e5cb2b14d13e3 1543w)
Capital Investment Priority–Setting for Transit in Large Metro Areas
A survey of the various factors that influence how transit agencies set their capital investment priorities, such as how investments in expansion projects might be weighed against existing assets.
![WP Capital Investment East Side Access Construction Site IMG6421 by RPA](https://img.imageboss.me/general/cover/300x300/fp-x:0.5,fp-y:0.5,quality:80/work/Reports/Archive-Featured-Reports/Transit-Leadership-Summit/WP-Capital-Investment-East-Side-Access-Construction-Site-IMG6421-by-RPA.jpg?bossToken=675dcace84683893dfe043d4f18623ef9ad837b24f965004cf8ba54259950c96 171w, https://img.imageboss.me/general/cover/600x600/fp-x:0.5,fp-y:0.5,quality:80/work/Reports/Archive-Featured-Reports/Transit-Leadership-Summit/WP-Capital-Investment-East-Side-Access-Construction-Site-IMG6421-by-RPA.jpg?bossToken=4acd0701ff3292668c815ff55133f1b1564100269b2ea490ddc03dd604b07f45 343w, https://img.imageboss.me/general/cover/900x900/fp-x:0.5,fp-y:0.5,quality:80/work/Reports/Archive-Featured-Reports/Transit-Leadership-Summit/WP-Capital-Investment-East-Side-Access-Construction-Site-IMG6421-by-RPA.jpg?bossToken=2d878430b64031ea1a96c0464022d46692c623d96b791b9889e7a6ce2d7800ec 514w, https://img.imageboss.me/general/cover/1200x1200/fp-x:0.5,fp-y:0.5,quality:80/work/Reports/Archive-Featured-Reports/Transit-Leadership-Summit/WP-Capital-Investment-East-Side-Access-Construction-Site-IMG6421-by-RPA.jpg?bossToken=0b04c2f99fd3a154309e7bc59d8edfe3bb28f33554ff5acc1fa9478ea39a76ec 686w, https://img.imageboss.me/general/cover/1500x1500/fp-x:0.5,fp-y:0.5,quality:80/work/Reports/Archive-Featured-Reports/Transit-Leadership-Summit/WP-Capital-Investment-East-Side-Access-Construction-Site-IMG6421-by-RPA.jpg?bossToken=0768921928a975cf595343307de6695dbe72432f87a772eb56a8a7bbf9fd737b 857w, https://img.imageboss.me/general/cover/1800x1800/fp-x:0.5,fp-y:0.5,quality:80/work/Reports/Archive-Featured-Reports/Transit-Leadership-Summit/WP-Capital-Investment-East-Side-Access-Construction-Site-IMG6421-by-RPA.jpg?bossToken=a5c7ccdf1c98f84c42e8e102ea8325ff1269822b537bf91982ca0fad6f16bb75 1029w, https://img.imageboss.me/general/cover/2100x2100/fp-x:0.5,fp-y:0.5,quality:80/work/Reports/Archive-Featured-Reports/Transit-Leadership-Summit/WP-Capital-Investment-East-Side-Access-Construction-Site-IMG6421-by-RPA.jpg?bossToken=6b8d7e998c9afa4b0b2d1af548b9c99c8b1da7ecdd1ea5c7fddaf3764f7d8465 1200w, https://img.imageboss.me/general/cover/2400x2400/fp-x:0.5,fp-y:0.5,quality:80/work/Reports/Archive-Featured-Reports/Transit-Leadership-Summit/WP-Capital-Investment-East-Side-Access-Construction-Site-IMG6421-by-RPA.jpg?bossToken=8d1df6f803501aa74020ea5fb28ca646c86965d71d2f6b746aeec9269281942b 1371w, https://img.imageboss.me/general/cover/2700x2700/fp-x:0.5,fp-y:0.5,quality:80/work/Reports/Archive-Featured-Reports/Transit-Leadership-Summit/WP-Capital-Investment-East-Side-Access-Construction-Site-IMG6421-by-RPA.jpg?bossToken=469e70360a78d7ab6b8601e776dd9eb23fd9bb89ad647c5f0e6fbdfa25612316 1543w)
Value Capture Opportunities for Urban Public Transport Finance
A study of the value that transit adds to cities, including a focus on contemporary value capture mechanisms used by transit agencies.
![WP Value Capture Flickr CC 8433437123 Hong Kong IFC Mall by Swire](https://img.imageboss.me/general/cover/300x300/fp-x:0.5,fp-y:0.5,quality:80/work/Reports/Archive-Featured-Reports/Transit-Leadership-Summit/WP-Value-Capture-Flickr-CC-8433437123-Hong-Kong-IFC-Mall-by-Swire.jpg?bossToken=1d822cd4ce6149d66600e543201852a9bda64aab8f8cd8e1dd5bc1c2d3377b5a 171w, https://img.imageboss.me/general/cover/600x600/fp-x:0.5,fp-y:0.5,quality:80/work/Reports/Archive-Featured-Reports/Transit-Leadership-Summit/WP-Value-Capture-Flickr-CC-8433437123-Hong-Kong-IFC-Mall-by-Swire.jpg?bossToken=18995cf8fb0a565e2d942a1da1de541570c38365895b68f08172bf635ed6c66c 343w, https://img.imageboss.me/general/cover/900x900/fp-x:0.5,fp-y:0.5,quality:80/work/Reports/Archive-Featured-Reports/Transit-Leadership-Summit/WP-Value-Capture-Flickr-CC-8433437123-Hong-Kong-IFC-Mall-by-Swire.jpg?bossToken=d4622abbb631e72236c6fccf63dc21c5994f3a4e44706ae05c26dadc03bf3625 514w, https://img.imageboss.me/general/cover/1200x1200/fp-x:0.5,fp-y:0.5,quality:80/work/Reports/Archive-Featured-Reports/Transit-Leadership-Summit/WP-Value-Capture-Flickr-CC-8433437123-Hong-Kong-IFC-Mall-by-Swire.jpg?bossToken=b9f6150698c343818ac6a2eadec0103fcee5b0903d9c6fdeb4780ba4c64355f8 686w, https://img.imageboss.me/general/cover/1500x1500/fp-x:0.5,fp-y:0.5,quality:80/work/Reports/Archive-Featured-Reports/Transit-Leadership-Summit/WP-Value-Capture-Flickr-CC-8433437123-Hong-Kong-IFC-Mall-by-Swire.jpg?bossToken=cf4c00aebc06ff93538cee11d19964d789216b4827988e7fe9777dc6549ffad7 857w, https://img.imageboss.me/general/cover/1800x1800/fp-x:0.5,fp-y:0.5,quality:80/work/Reports/Archive-Featured-Reports/Transit-Leadership-Summit/WP-Value-Capture-Flickr-CC-8433437123-Hong-Kong-IFC-Mall-by-Swire.jpg?bossToken=f0ee4131c3f2a5a8be7681971862bb6259fcd2c9cc93581098c0bde0c302d058 1029w, https://img.imageboss.me/general/cover/2100x2100/fp-x:0.5,fp-y:0.5,quality:80/work/Reports/Archive-Featured-Reports/Transit-Leadership-Summit/WP-Value-Capture-Flickr-CC-8433437123-Hong-Kong-IFC-Mall-by-Swire.jpg?bossToken=edc8eb16840591c1eb799707fb924218040d1274e3399a52c832023d14941f13 1200w, https://img.imageboss.me/general/cover/2400x2400/fp-x:0.5,fp-y:0.5,quality:80/work/Reports/Archive-Featured-Reports/Transit-Leadership-Summit/WP-Value-Capture-Flickr-CC-8433437123-Hong-Kong-IFC-Mall-by-Swire.jpg?bossToken=68ca2918a6f5520d46ccd137ea911c1d9be0f0694f97e557e4ad75085cbf1dae 1371w, https://img.imageboss.me/general/cover/2700x2700/fp-x:0.5,fp-y:0.5,quality:80/work/Reports/Archive-Featured-Reports/Transit-Leadership-Summit/WP-Value-Capture-Flickr-CC-8433437123-Hong-Kong-IFC-Mall-by-Swire.jpg?bossToken=d647c5091944812dfa9b60c48db53ad46f032e3a9bc8741574cb347e13b59a2e 1543w)
Urban Transit Systems and Conditions of Enhanced Climate Variability
A study of how erratic weather and the increased threat of flooding, heat and high winds will affect transit systems, including actions institutions are taking to adjust to new coniditons.
![WP Climate Hurricane Sandy Suomi NPP VIIRS 10282012 by NASA Earth Observatory](https://img.imageboss.me/general/cover/300x300/fp-x:0.5,fp-y:0.5,quality:80/work/Reports/Archive-Featured-Reports/Transit-Leadership-Summit/WP-Climate-Hurricane-Sandy-Suomi-NPP-VIIRS-10282012-by-NASA-Earth-Observatory.jpg?bossToken=e11f525084a5051ae68aee9c83a6653f2e48fb508f2e46afd8ce8ac95b63fe0b 171w, https://img.imageboss.me/general/cover/600x600/fp-x:0.5,fp-y:0.5,quality:80/work/Reports/Archive-Featured-Reports/Transit-Leadership-Summit/WP-Climate-Hurricane-Sandy-Suomi-NPP-VIIRS-10282012-by-NASA-Earth-Observatory.jpg?bossToken=15f09428219ed4b727b6a2ceb17cf88c3db1f106a7602766bb9cb826fe4463fc 343w, https://img.imageboss.me/general/cover/900x900/fp-x:0.5,fp-y:0.5,quality:80/work/Reports/Archive-Featured-Reports/Transit-Leadership-Summit/WP-Climate-Hurricane-Sandy-Suomi-NPP-VIIRS-10282012-by-NASA-Earth-Observatory.jpg?bossToken=8cae6b3f301f8b379d7ee41adb79b13519184e505f83ad9e30acdd3ee4ee08af 514w, https://img.imageboss.me/general/cover/1200x1200/fp-x:0.5,fp-y:0.5,quality:80/work/Reports/Archive-Featured-Reports/Transit-Leadership-Summit/WP-Climate-Hurricane-Sandy-Suomi-NPP-VIIRS-10282012-by-NASA-Earth-Observatory.jpg?bossToken=f006cfb5fe49cb373496390bde44efc1fba749fd07dadb5cc56ed102ffc73286 686w, https://img.imageboss.me/general/cover/1500x1500/fp-x:0.5,fp-y:0.5,quality:80/work/Reports/Archive-Featured-Reports/Transit-Leadership-Summit/WP-Climate-Hurricane-Sandy-Suomi-NPP-VIIRS-10282012-by-NASA-Earth-Observatory.jpg?bossToken=eb3d97b5cd2440dbcf88a16ae1f99f32ed945cbc5217afaf30f2576e84f8199d 857w, https://img.imageboss.me/general/cover/1800x1800/fp-x:0.5,fp-y:0.5,quality:80/work/Reports/Archive-Featured-Reports/Transit-Leadership-Summit/WP-Climate-Hurricane-Sandy-Suomi-NPP-VIIRS-10282012-by-NASA-Earth-Observatory.jpg?bossToken=227017ee3432a304291495b13cc9e92d7545c852c01b9725a03e40197ffb1fee 1029w, https://img.imageboss.me/general/cover/2100x2100/fp-x:0.5,fp-y:0.5,quality:80/work/Reports/Archive-Featured-Reports/Transit-Leadership-Summit/WP-Climate-Hurricane-Sandy-Suomi-NPP-VIIRS-10282012-by-NASA-Earth-Observatory.jpg?bossToken=f3d099d773e9471737c0daa8b4606b44b3028850cd07fd5afe2f22a3a1fc90b0 1200w, https://img.imageboss.me/general/cover/2400x2400/fp-x:0.5,fp-y:0.5,quality:80/work/Reports/Archive-Featured-Reports/Transit-Leadership-Summit/WP-Climate-Hurricane-Sandy-Suomi-NPP-VIIRS-10282012-by-NASA-Earth-Observatory.jpg?bossToken=72c48c591be9480ef5e27e80539e2e34652fa4a3864676e2ab49df960cfe06d2 1371w, https://img.imageboss.me/general/cover/2700x2700/fp-x:0.5,fp-y:0.5,quality:80/work/Reports/Archive-Featured-Reports/Transit-Leadership-Summit/WP-Climate-Hurricane-Sandy-Suomi-NPP-VIIRS-10282012-by-NASA-Earth-Observatory.jpg?bossToken=4550a4e5b370320d880976974de4f1218aeb815f51d7758cffa82d0477af68b1 1543w)
Door to Door: Combined Mobility and the Changing Transit Landscape
A survey of land use, urban design and organizational strategies for achieving new levels of interconnectivity, including ways to expand transit accessibility into complex regional settings.
![WP Combined Mobility Flickr CC 5744826770 Radstation by Philly Bike Coalition](https://img.imageboss.me/general/cover/300x300/fp-x:0.5,fp-y:0.5,quality:80/work/Reports/Archive-Featured-Reports/Transit-Leadership-Summit/WP-Combined-Mobility-Flickr-CC-5744826770-Radstation-by-Philly-Bike-Coalition.jpg?bossToken=5c375ad853784b3a25cc40768bdae43087c299fc887fabc797b83e961f3f403b 171w, https://img.imageboss.me/general/cover/600x600/fp-x:0.5,fp-y:0.5,quality:80/work/Reports/Archive-Featured-Reports/Transit-Leadership-Summit/WP-Combined-Mobility-Flickr-CC-5744826770-Radstation-by-Philly-Bike-Coalition.jpg?bossToken=f680d991e1dbfaf066c98ad1878960e33a5ac649a164ed70f87c10d0e9e62442 343w, https://img.imageboss.me/general/cover/900x900/fp-x:0.5,fp-y:0.5,quality:80/work/Reports/Archive-Featured-Reports/Transit-Leadership-Summit/WP-Combined-Mobility-Flickr-CC-5744826770-Radstation-by-Philly-Bike-Coalition.jpg?bossToken=68d047323f1fe0d6391cb63e7112f12b288fcdde3e09ba476e66276341d90c60 514w, https://img.imageboss.me/general/cover/1200x1200/fp-x:0.5,fp-y:0.5,quality:80/work/Reports/Archive-Featured-Reports/Transit-Leadership-Summit/WP-Combined-Mobility-Flickr-CC-5744826770-Radstation-by-Philly-Bike-Coalition.jpg?bossToken=b850f9c74a9b2b7ef380c3c60655fa980c56ae2a083244540a1e4eff10f64b1b 686w, https://img.imageboss.me/general/cover/1500x1500/fp-x:0.5,fp-y:0.5,quality:80/work/Reports/Archive-Featured-Reports/Transit-Leadership-Summit/WP-Combined-Mobility-Flickr-CC-5744826770-Radstation-by-Philly-Bike-Coalition.jpg?bossToken=817c2ee49ba2973d37f36ba7e46cc992ea31714b34487b181a2c05d46676413f 857w, https://img.imageboss.me/general/cover/1800x1800/fp-x:0.5,fp-y:0.5,quality:80/work/Reports/Archive-Featured-Reports/Transit-Leadership-Summit/WP-Combined-Mobility-Flickr-CC-5744826770-Radstation-by-Philly-Bike-Coalition.jpg?bossToken=6ebd00fd8f6c3d79f87c158f26598c71d293f085e8269e46549f5c537cfaa78f 1029w, https://img.imageboss.me/general/cover/2100x2100/fp-x:0.5,fp-y:0.5,quality:80/work/Reports/Archive-Featured-Reports/Transit-Leadership-Summit/WP-Combined-Mobility-Flickr-CC-5744826770-Radstation-by-Philly-Bike-Coalition.jpg?bossToken=98a1195513d8faf0bde7bfa6ad397efab68bc2edbcf7a6233730b93aa3d1b934 1200w, https://img.imageboss.me/general/cover/2400x2400/fp-x:0.5,fp-y:0.5,quality:80/work/Reports/Archive-Featured-Reports/Transit-Leadership-Summit/WP-Combined-Mobility-Flickr-CC-5744826770-Radstation-by-Philly-Bike-Coalition.jpg?bossToken=fcda90bb7e6ada91272708d7c0915ef8fa1cac64b01ed96b11c429eff6a02569 1371w, https://img.imageboss.me/general/cover/2700x2700/fp-x:0.5,fp-y:0.5,quality:80/work/Reports/Archive-Featured-Reports/Transit-Leadership-Summit/WP-Combined-Mobility-Flickr-CC-5744826770-Radstation-by-Philly-Bike-Coalition.jpg?bossToken=70c2a96d74896256d47658fcd8ad64de66b9059f589038fa08f01998d8294cc9 1543w)
Acknowledgements
Authored by
-
Elliott Sclar
Columbia University, Professor
Additional Content and Support
- Rohit Aggarwala
- C40 Cities Climate Leadership Group
- Terri Wills
- C40 Cities Climate Leadership Group
- Andrew Bata
- New York Metropolitan Transportation Authority
- Ang Chor Ing
- Singapore Land Transport Authority
- Chik Cheong
- Singapore Land Transport Authority
- Nadiah Loh
- Singapore Land Transport Authority
- Isabel Dedring
- Greater London Authority
- Dominic Hurley
- Greater London Authority
- Simon Rees
- Greater London Authority
- Caroline Murphy
- Transport for London
- Kerri Rogan
- Transport for London
- Elaine Seagrif
- Transport for London
- Anders Brännström
- VREF
- Måns Lönnroth
- VREF
- Henrik Nolmark
- VREF
- Elliot “Lee” Sander
Produced With
- Volvo Research and Educational Foundations
- C40 Cities Climate Leadership Group
- Rockefeller Brothers Fund
- Singapore Land Transport Authority
- Transport for London and the office of the Mayor of London
Related Reports
461