
With the growing threat of climate change, New York City is implementing actions and policies to mitigate and reduce its impact. The city’s sustainability plan, “PlaNYC: Getting Sustainability Done,” highlights vital areas that need to be addressed, such as protecting from flood events, promoting clean energy in buildings, expanding open spaces and parks, as well as an emphasis on the importance of mitigating extreme heat. With the collaboration of community-based organizations, the city is leading a significant tree-planting initiative, as outlined in Local Law 1065 (LL 1065). The city has set the goal of planting thousands of trees across the city to support efforts to improve air quality. Enacted in November 2023, LL 1065 lays the groundwork for the city’s urban forest objectives and aims to expand the city’s canopy coverage from the current 22% to 30% as recommended by the NYC Urban Forest Agenda.
In its fourth regional plan, RPA underscores the pivotal role of trees, open spaces, parks, and green infrastructure in addressing climate change, particularly in mitigating the hazards associated with high temperatures and urban heat islands (UHI). The plan outlines three critical environmental goals for the region: first, institutionalizing greening initiatives and relief programs at the community level; second, mandating major urban projects to incorporate green elements; and third, employing pilot programs to assess the impact of natural approaches and develop community-based solutions. Furthermore, RPA publicly supported LL 1065 and the proposed city-wide urban forest master plan, emphasizing the necessity of strict timelines to ensure effective implementation and highlighting the importance of prioritizing environmental justice communities historically in environmental justice communities.
Under LL 1065, the city is mandated to create an urban forest master plan to be submitted by July 31, 2024, which would be updated every decade. This comprehensive plan will examine the factors influencing changes in canopy coverage, offering strategic recommendations to prevent future canopy loss and promote tree canopy growth. Additionally, the plan requires the development of outreach and education programs to inform property owners about best practices for protecting existing trees and planting new ones.
LL 1065 has laid a strong foundation to increase canopy coverage, support the city’s efforts in combating the effects of climate change, and reach the city’s sustainability goals. However, its success depends on various critical factors like setting specific targets, implementing effective enforcement mechanisms, fostering cooperation among city agencies, and investing in historically underinvested neighborhoods and communities.
Local Law 1065 stands as a milestone of the city’s tree-planting efforts, aligning with its environmental objectives and building upon the foundation laid by the Million Trees NYC Program (MTNYC) initiated in 2007. The MTNYC set out an ambitious goal of planting 1 million trees across the city’s five boroughs, with a budget totaling up to $365 million allocated over several fiscal years. The program successfully reached its goal of planting 1 million trees ahead of schedule, completing the project in under 10 years. Looking back, however, prioritizing the overall quantity of trees planted might not have been the most effective strategy. It could have been more impactful if there was an effort to prioritize planting trees in locations where their environmental and community impact would be most substantial.
While LL 1065 aims to achieve ambitious and important environmental goals, it would benefit from a more detailed plan outlining the distribution of new trees across streets, parks, open areas, and various neighborhoods. A more comprehensive approach to tree planting and distribution could ensure that the benefits of urban forestry are accessible to all communities, especially those most in need. LL 1065 should learn from past initiatives’ mistakes and prioritize a more precise and equitable allocation of trees rather than just the total canopy coverage goal, especially among environmental justice communities. A closer examination of existing tree and canopy coverage data in New York City, taking Brooklyn as a case study, reveals discrepancies in the current distribution of trees, indicating a need for further attention and action to ensure the successful implementation of the law’s objectives and the city’s environmental justice goals.
This research offers a new approach to urban forestry building on LL 1065, existing policies, and the legacy of tree planting initiatives in NYC. The following sections will cover the current state of New York City trees and canopy coverage distribution, and offer recommendations for developing new urban forest zones (UFZ) to support the implementation of LL 1065 and its historic environmental goals.
As a result of climate change, New York City experiences extreme weather conditions, including extreme heat. An analysis of the UHI severity in Brooklyn was conducted using data from 2019. The findings indicate that the most severe UHI effect is concentrated in Brooklyn’s northern, northeastern, and western neighborhoods, particularly Sunset Park. The area impacted by UHI covers 20,410 acres, representing approximately 46% of Brooklyn’s total land coverage. It is important to note that the analysis and maps only depict UHI severity and not land surface temperatures, extreme heat events, or other temperature variations.

Source: The Trust for Public Land. Urban Heat Island Severity for U.S. Cities (2019)
Different methods can be used to evaluate New York City’s total canopy coverage and its status across neighborhoods. This research utilized two datasets: Google’s Environmental Insights Explorer (EIE) and the city’s Tree Canopy Change from 2010 to 2017. Both data sets estimate canopy coverage for a similar period. Comparing the two provides a comprehensive and nuanced understanding of the current state of tree coverage change in NYC.
According to data obtained from Google EIE spanning 2014 to 2022, NYC’s total tree coverage extends across approximately 44,000 acres, constituting 23% of the city’s area. This suggests that progress toward the city’s goal of achieving 30% canopy coverage is underway. Figure 2 illustrates the percentage of canopy coverage by census tract across NYC, which includes parks, open spaces, and street trees.
Based on the 2015 street tree census, the number of street trees in each of the five boroughs in NYC varies. Queens has the highest number of street trees, totaling 237,974, followed by Brooklyn with 169,744, Staten Island with 101,443, the Bronx with 80,585, and Manhattan with 62,427. Combined, these figures culminate in 652,173 live street trees across the city.

Figure 2: Percentage of Canopy Coverage, NYC
Although overall canopy coverage is around 23%, focusing solely on streets presents a different perspective. The analysis utilizes the Tree Canopy Change dataset spanning from 2010 to 2017, with a specific emphasis on the evaluation of street canopy coverage. Notably, the mapping process deliberately excluded parks, open spaces, and airports, ensuring a concentrated focus on street-level canopy coverage. This approach is crucial to get a nuanced understanding of urban landscapes, particularly in enhancing factors such as walkability and cycling.
The City’s evaluation of canopy change between 2010 and 2017 highlights shifts in canopy coverage and is divided into three categories: No Change in canopy, canopy Gain, and Loss of canopy. For instance, some trees may have experienced canopy growth on a particular block or street, while others may have remained unchanged or seen partial canopy loss. Canopy growth may have resulted from tree growth or new tree planting. In contrast, canopy loss could be due to tree death or the effects of diseases leading to canopy loss.
The analysis finds that around 64% of New York City’s street canopy remained unchanged during the period measured. The study also showed a 23% increase in canopy coverage, indicating positive growth. However, there was a 13% decrease in street canopy, indicating a reduction in coverage during the same time frame. By 2017, street canopy coverage on streets totaled about 18,367 acres, representing nearly 10% of the city’s total land area.
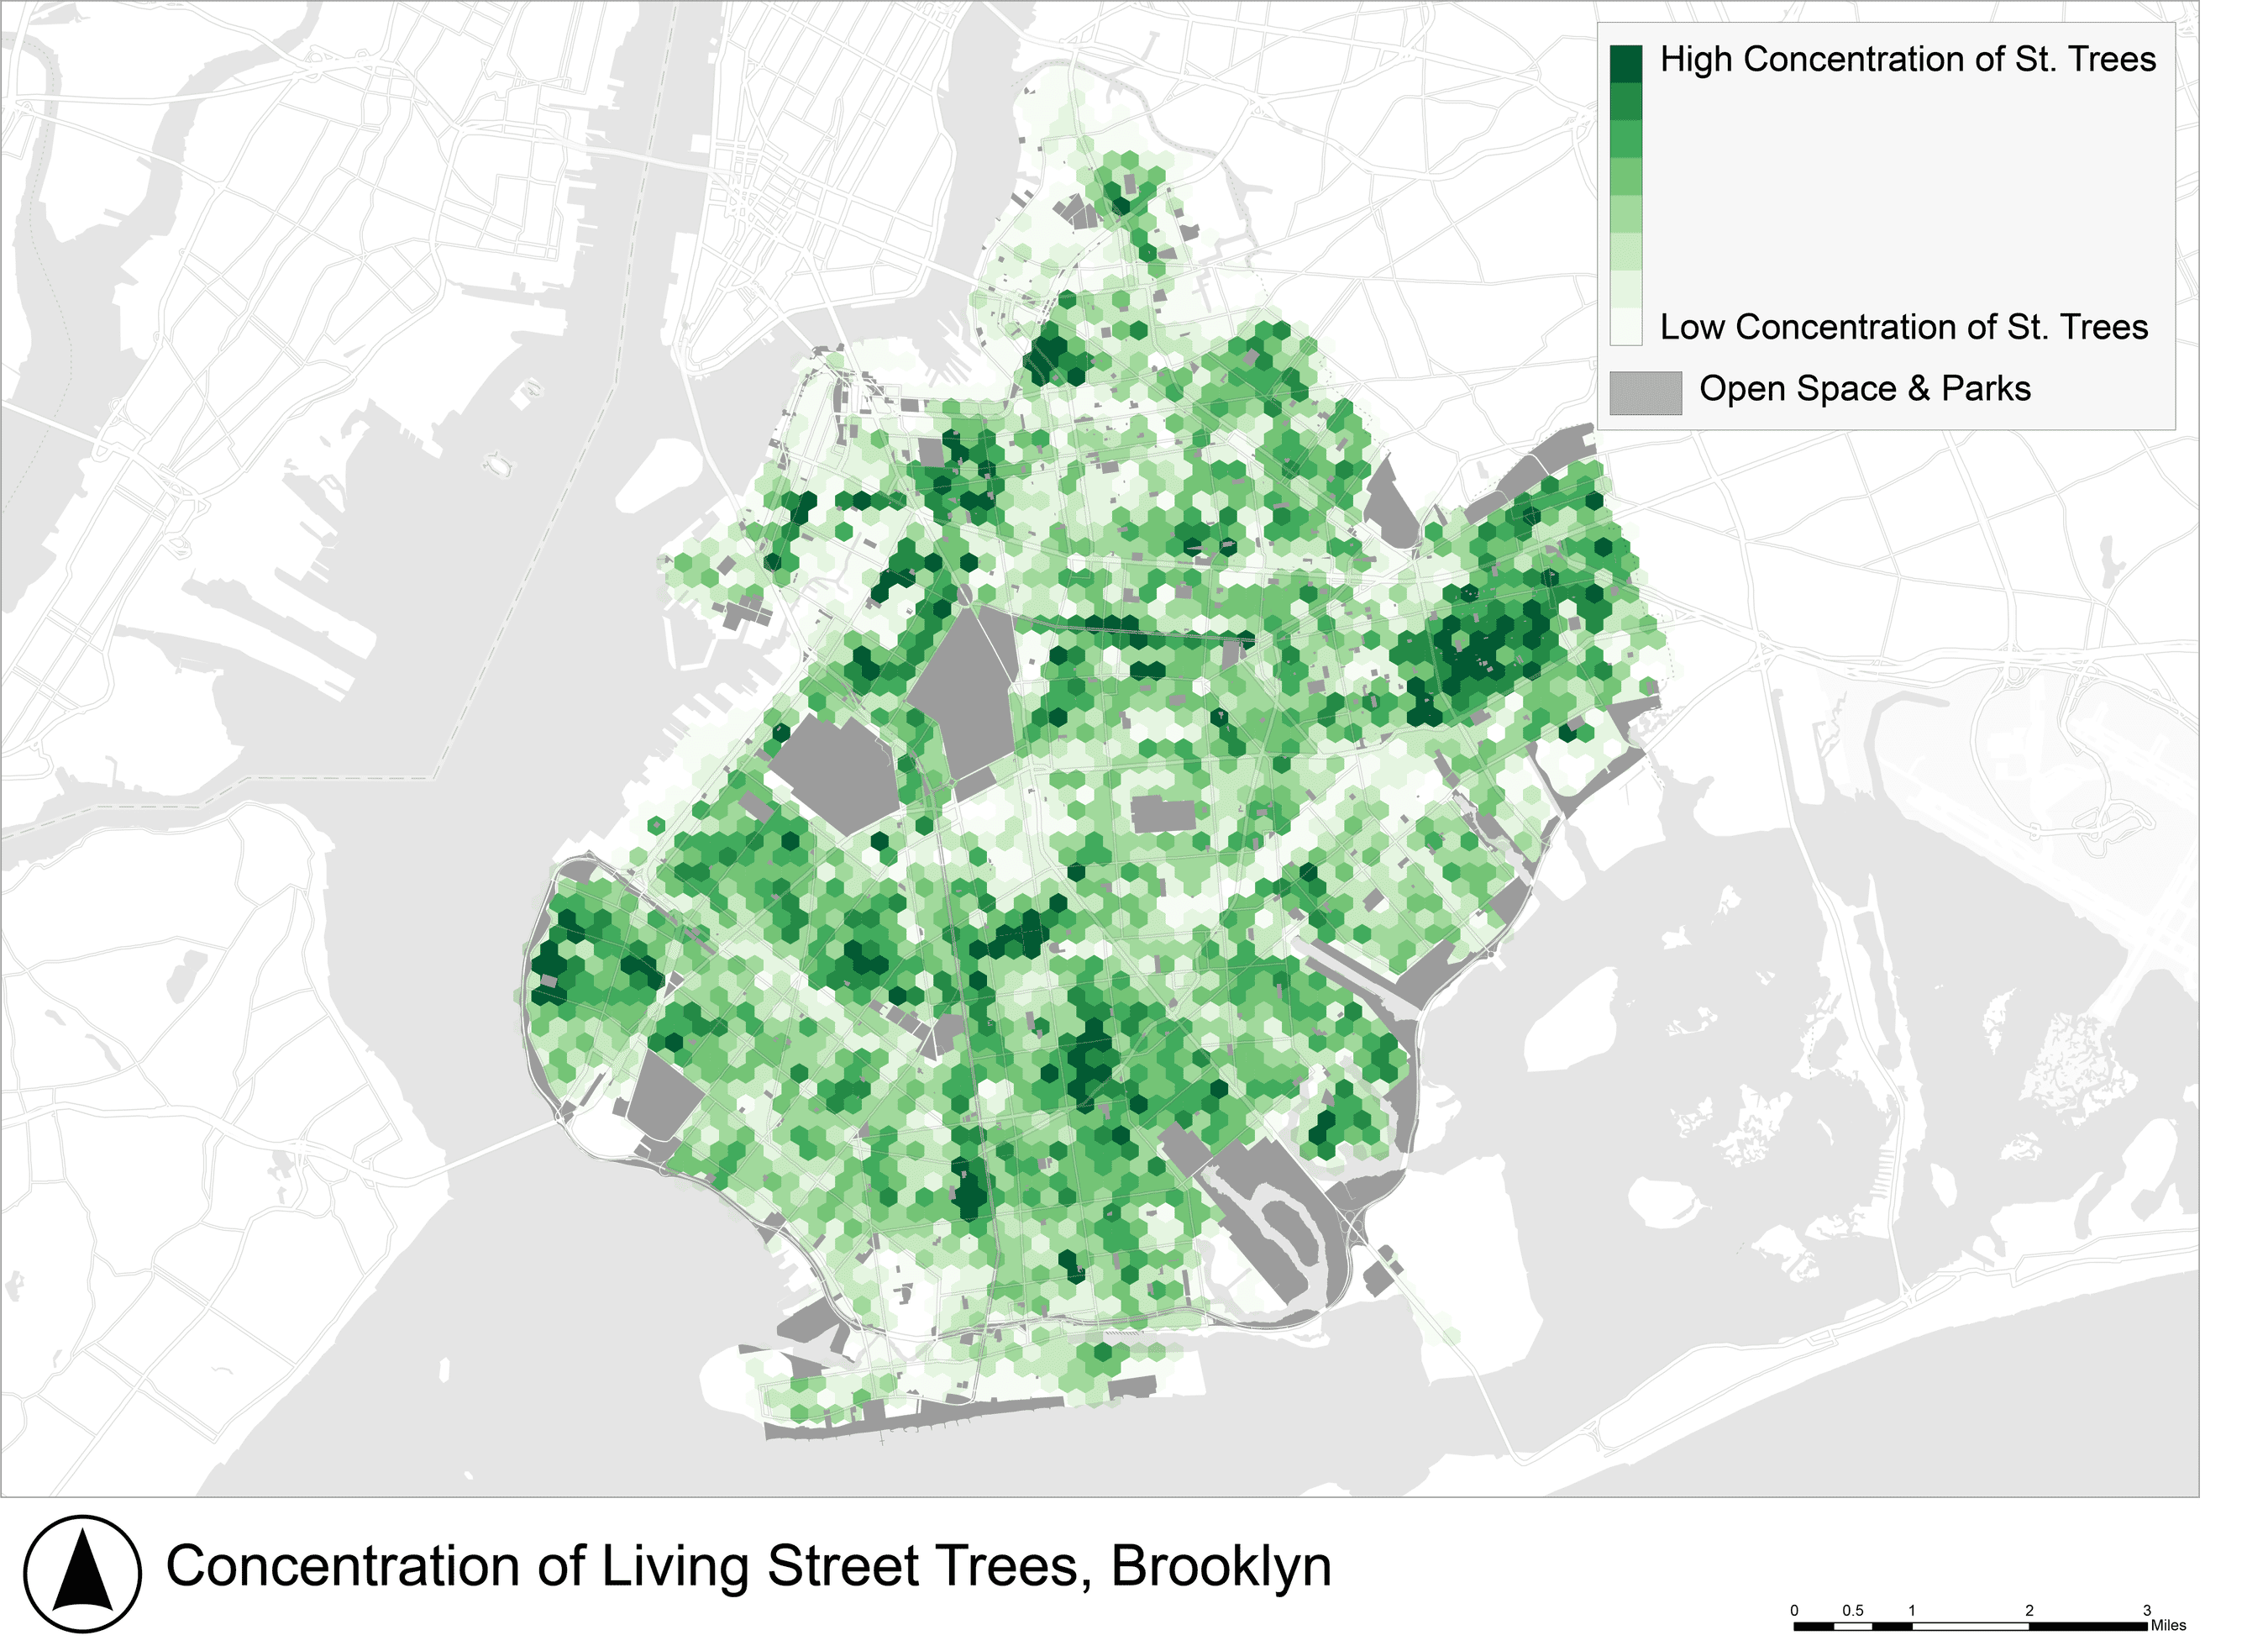
Analyzing Brooklyn as a case study provides insights into the current state of street trees and the potential for future development of the borough’s urban forest. With approximately 170,000 living street trees, Brooklyn’s canopy coverage presents significant opportunities. The concentration of living street trees in Brooklyn is presented in Figure 3, with white and light green indicating a low concentration and darker green symbolizing a higher number of street trees.
The study reveals that approximately 75% of street segments in Brooklyn have a canopy coverage ranging from 0% to 25%, as depicted in Figure 4. This study evaluates the canopy coverage of existing canopies along the 60-foot-wide streets of Brooklyn. In Figure 5, a street map of Brooklyn illustrates the diverse levels of canopy coverage along streets. Red indicates low coverage, and green highlights higher percentages, emphasizing the spatial distribution of urban tree canopy within the borough.
The study finds that street trees are not equally distributed across the borough, resulting in uneven canopy coverage for Brooklyn residents. This imbalance leads to environmental disparities, placing certain communities at a higher risk of exposure to UHI effects, asthma, air pollution, and other environmental hazards.
The following section outlines an alternative approach to address the uneven distribution of street trees and canopy coverage among Brooklyn’s neighborhoods. Furthermore, it presents a model that can be used to identify appropriate locations for tree planting and implement them throughout all five boroughs. Taking advantage of LL 1065 and the city’s initiative to increase canopy coverage, the model can be used as a guide and provides suggestions for fairly distributing the targeted 30% canopy coverage. This will ensure that all residents of NYC can benefit from the improved urban greenery.
Source: NYC DPR, 2017

Source: NYC OTI, 2022b, 2023
LL 1065 and its 30% canopy coverage goal mark a significant step in redefining the concept of urban greenery and reshaping the integration of urban forests into the city’s landscape. The model proposed below advocates for customizing the 30% canopy coverage goal into a site-specific action plan tailored to prioritize environmental justice communities. This approach aims to address the disparities in canopy coverage across neighborhoods and ensure equitable access to the benefits of urban forestry.
Using Brooklyn as a case study for new UFZ development, Figure 6 displays the areas most needed for UFZ development. The model uses 5 datasets comprising the final result. Each is given respective importance (weight), with those assigned a higher weight in the model having a more significant impact on the final suitability model. The final result integrates several variables, which include the number of living street trees, focusing on areas with lower tree concentrations; UHI severity; lower levels of Median Household Income from 2017 to 2021; communities at higher risk as defined by NYSERDA’s Disadvantaged Communities Index; and New York City’s land use categorization, with an emphasis on residential and mixed-use areas. This model can be expanded to other boroughs and modified by adding more variables (e.g. environmental and demographic factors).
Figure 6 maps locations in Brooklyn identified as more suitable for UFZ expansion, with high-priority areas marked in red and low-priority areas in green. This data-driven approach can inform policy decisions regarding the strategic placement of trees to address environmental equity and enhance urban greenery. Additionally, a statistical analysis was conducted on the potential development of UFZ, as depicted in Figure 7. This analysis identifies clusters of UFZ with varying suitability levels, represented by hot spots (red) or cold spots (blue) across three confidence levels (see Appendix 2 for a detailed explanation of the statistical results).

Source: DCP, 2023; IPUMS, NHGIS; University of Minnesota, n.d.; NYC DPR, 2017; NYSERDA, 2023; The Trust for Public Land, 2019
Aligned with the goals of LL 1065 and the sustainability objectives outlined in PlaNYC, the following recommendations aim to enhance the implementation of the 30% canopy coverage goal and ensure equitable tree and green infrastructure distribution, focusing on environmental justice communities. The recommendations center on three main areas: establishing urban forest zones, appointing an urban forest coordinator, and implementing measures to address extreme heat.
Establishing Urban Forest Zones
The first recommendation seeks to establish Urban Forest Zones (UFZ). These areas are strategic locations aimed at promoting the expansion of urban forests, with a particular focus on environmental justice communities. As shown in the maps and analysis above, these priority sites can be determined by the methodology suggested in the research, which can be expanded to more locations across the city and include additional indicators.
UFZs could follow a similar logic used in establishing Business Improvement Districts (BIDs), which are designated areas based on financial needs rather than more common boundaries such as neighborhoods or census tracts. However, in the case of UFZs, the focus would be on environmental and sustainability indicators rather than financial. The enactment of LL 1065, which mandates the development of an urban forest master plan by July 31, 2024, underscores the importance of this recommendation in providing guidelines for implementation and subsequent enforcement.
Introducing the Urban Forest Coordinator
The second recommendation proposes the establishment of a city-wide Urban Forest Coordinator position. The Urban Forest Coordinator could play a vital role in the long-term planning, strategic vision, and evaluation of urban forestry initiatives. This position could serve two primary objectives: the first is to strategically plan and develop UFZs across the city, and the second is to coordinate between different city agencies to advocate for its success. This position mirrors the Chief Public Realm Officer (CPRO) role established by Mayor Adams in February 2023. The Urban Forest Coordinator could work independently while coordinating with city agencies or be integrated into the CPRO’s office and tasked with enhancing green public spaces and UFZs.
Mitigating Urban Heat Islands
The third and final recommendation emphasizes the importance of carefully selecting sites for street tree planting, particularly in areas experiencing high temperatures and an extreme UHI effect. As mentioned, canopy coverage and street tree planting are not equally distributed across the city. Trees have a significant impact on the environment, particularly in their ability to reduce temperatures and mitigate the UHI effect.
Integrating indicators for extreme heat and UHI effect into the urban forest expansion master plan can support the city’s efforts to identify areas for tree planting. This ensures that the expansion of canopy coverage is strategically planned to mitigate heat risks across the city, with equitable allocation to ensure all NYC residents benefit from its effects.
This strategy aims to mitigate the adverse impacts of UHI, enhance urban resilience, and promote community well-being by strategically adding trees to areas most vulnerable to extreme heat. Additional research and data are necessary to identify the areas at the greatest risk from extreme heat and to implement the most effective nature-based solutions, such as green roofs, green walls, and tree planting.
-
The canopy calculations along streets were confined to a 100-foot width, excluding open spaces and parks from the assessment.
The statistical analysis of hot spots includes results with (+/-3, +/-2, and +/-1 bins), representing 99%, 95%, and 90% confidence levels, respectively. A value of 0 indicates no statistical significance.
-
Aminipouri, M.; Knudby, A. J.; Krayenhoff, E. S. et al.2019 Modeling the impact of increased street tree cover on mean radiant temperature across Vancouver’s local climate zones. Urban Forestry & Urban Greening 39: 9–17.
Google Environmental Insights Explorer. (2023, August). New York—Tree canopy. Google EIE.
NYC DPR. (2017, October 4). 2015 Street Tree Census—Tree Data
NYC OTI. (2022, September 23). Tree Canopy Change (2010—2017)
NYSERDA. (2023, October 10). Final Disadvantaged Communities (DAC) 2023.
The Trust for Public Land. (2019, September 13). Urban Heat Island Severity for U.S. Cities 2019.